Presentation with a dashboard
Click Presentation view on the basic dashboard page to view workbook dashboards with a presentation UI. In this mode, you can easily report and share data analytics results.
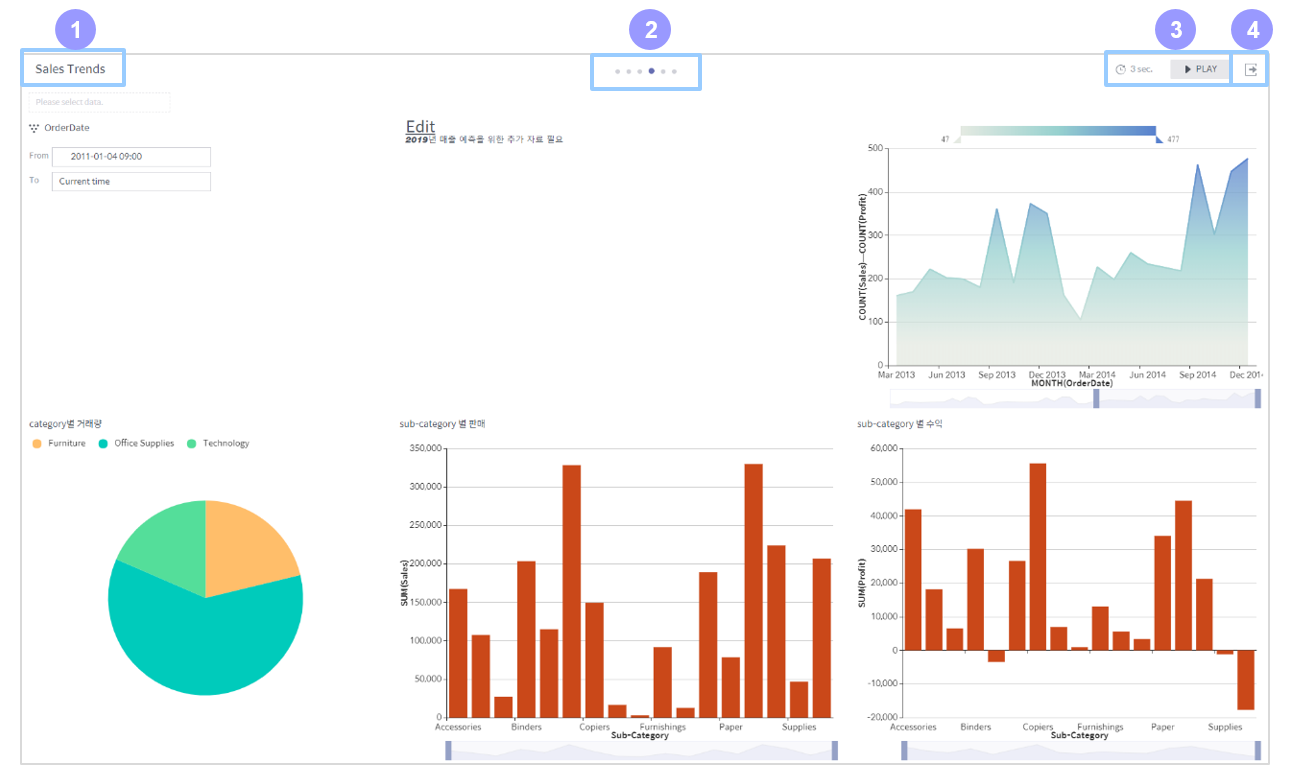
Name: Name of the current dashboard.
Slide navigation: Each circle represents a different dashboard in the workbook. For example, if you click the 4th circle, the 4th dashboard slide will be displayed with that circle highlighted.
Auto slide show settings: Select a duration for each slide and click PLAY to start an auto slide show.
Exit: Closes the presentation view and returns to the workbook/dashboard basic page.