Monitoring
The Monitoring tab on the main page of Integrator displays runs and schedule information in graph form for each workflow.
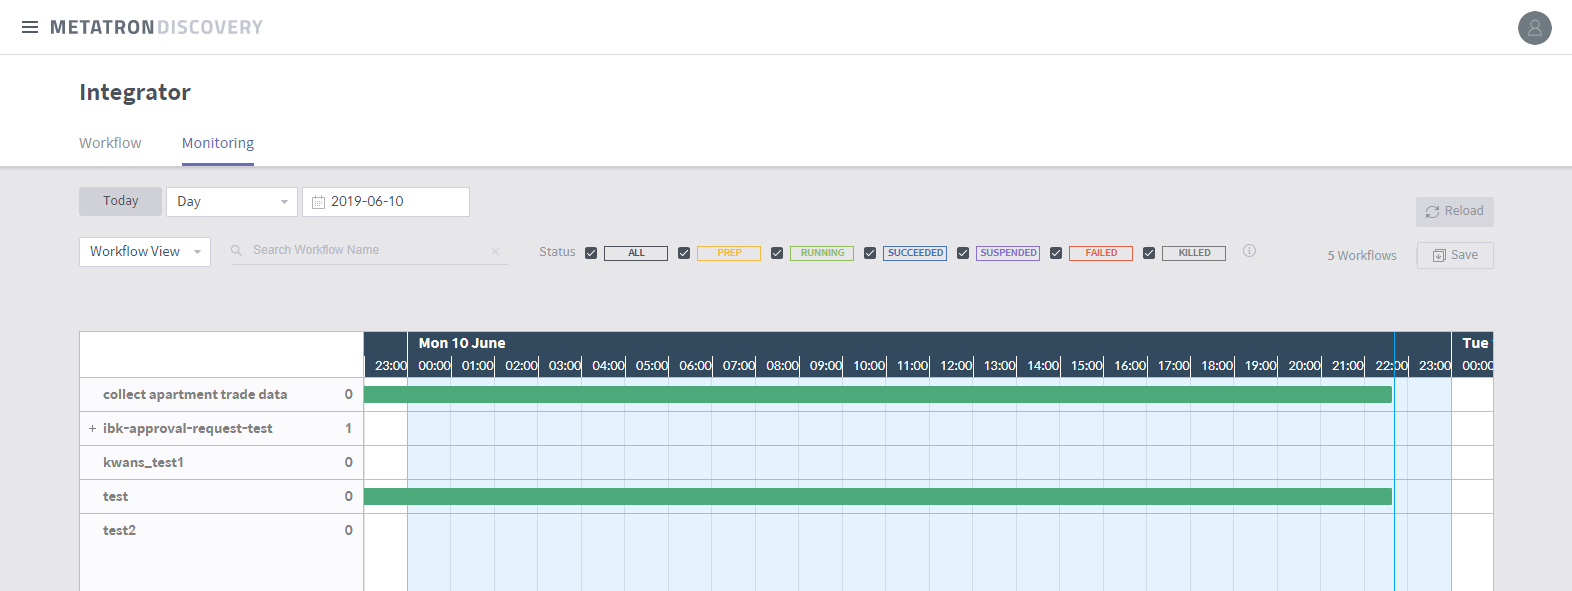
The status bars of the graph represent scheduled or manual runs, and related information is presented as follows:
Position and length: The status bar spans the duration of the run represented on the timeline.
Color: The status bar is displayed in the same color as the color of the Status item in the top legend. For example, a status bar in green indicates that the run is ongoing.
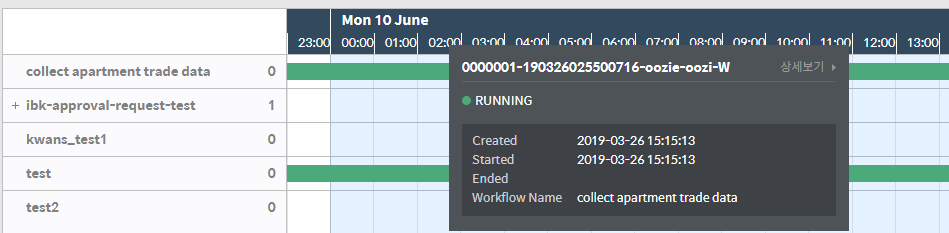
Hovering the cursor over the status bar displays the run details as shown below. Click View details on the top right of the dialog box to view more detailed information.