Search
In general, there is a system for detecting outliers and a system for querying data, so you need to access another system to search for data to find the cause immediately after anomaly detection. Metatron Anomaly provides the ability to query various data sources selected by the user within the same system immediately after receiving an anomaly detection alarm.
Selecting Data Source
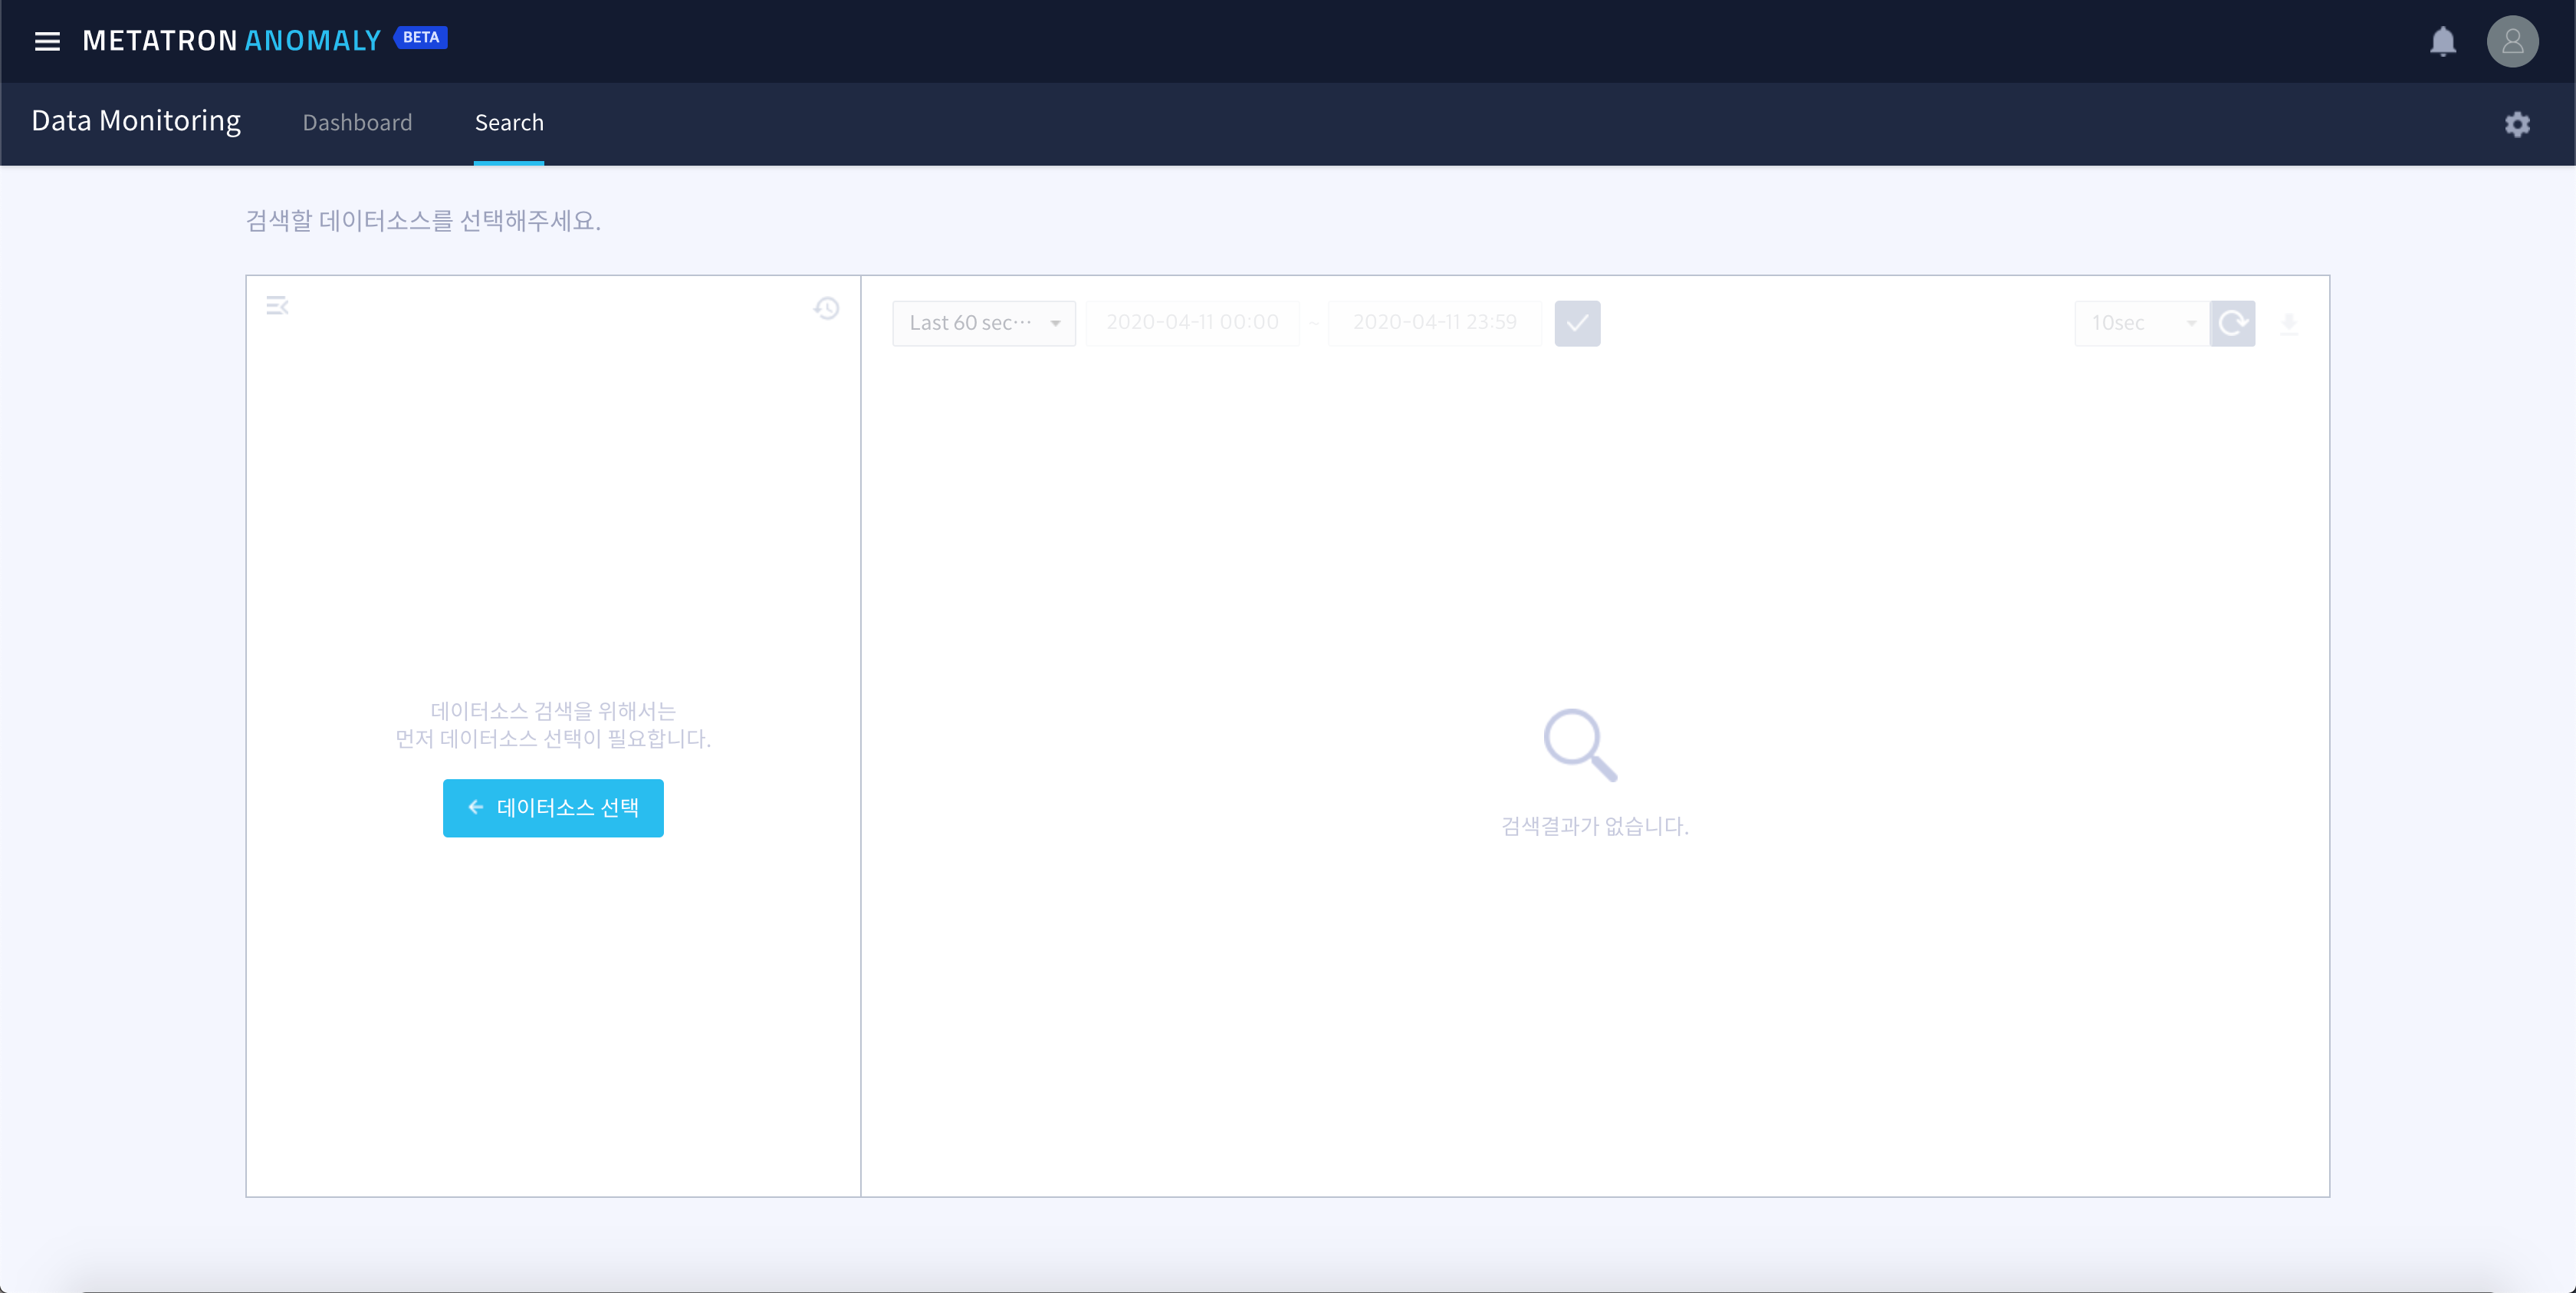
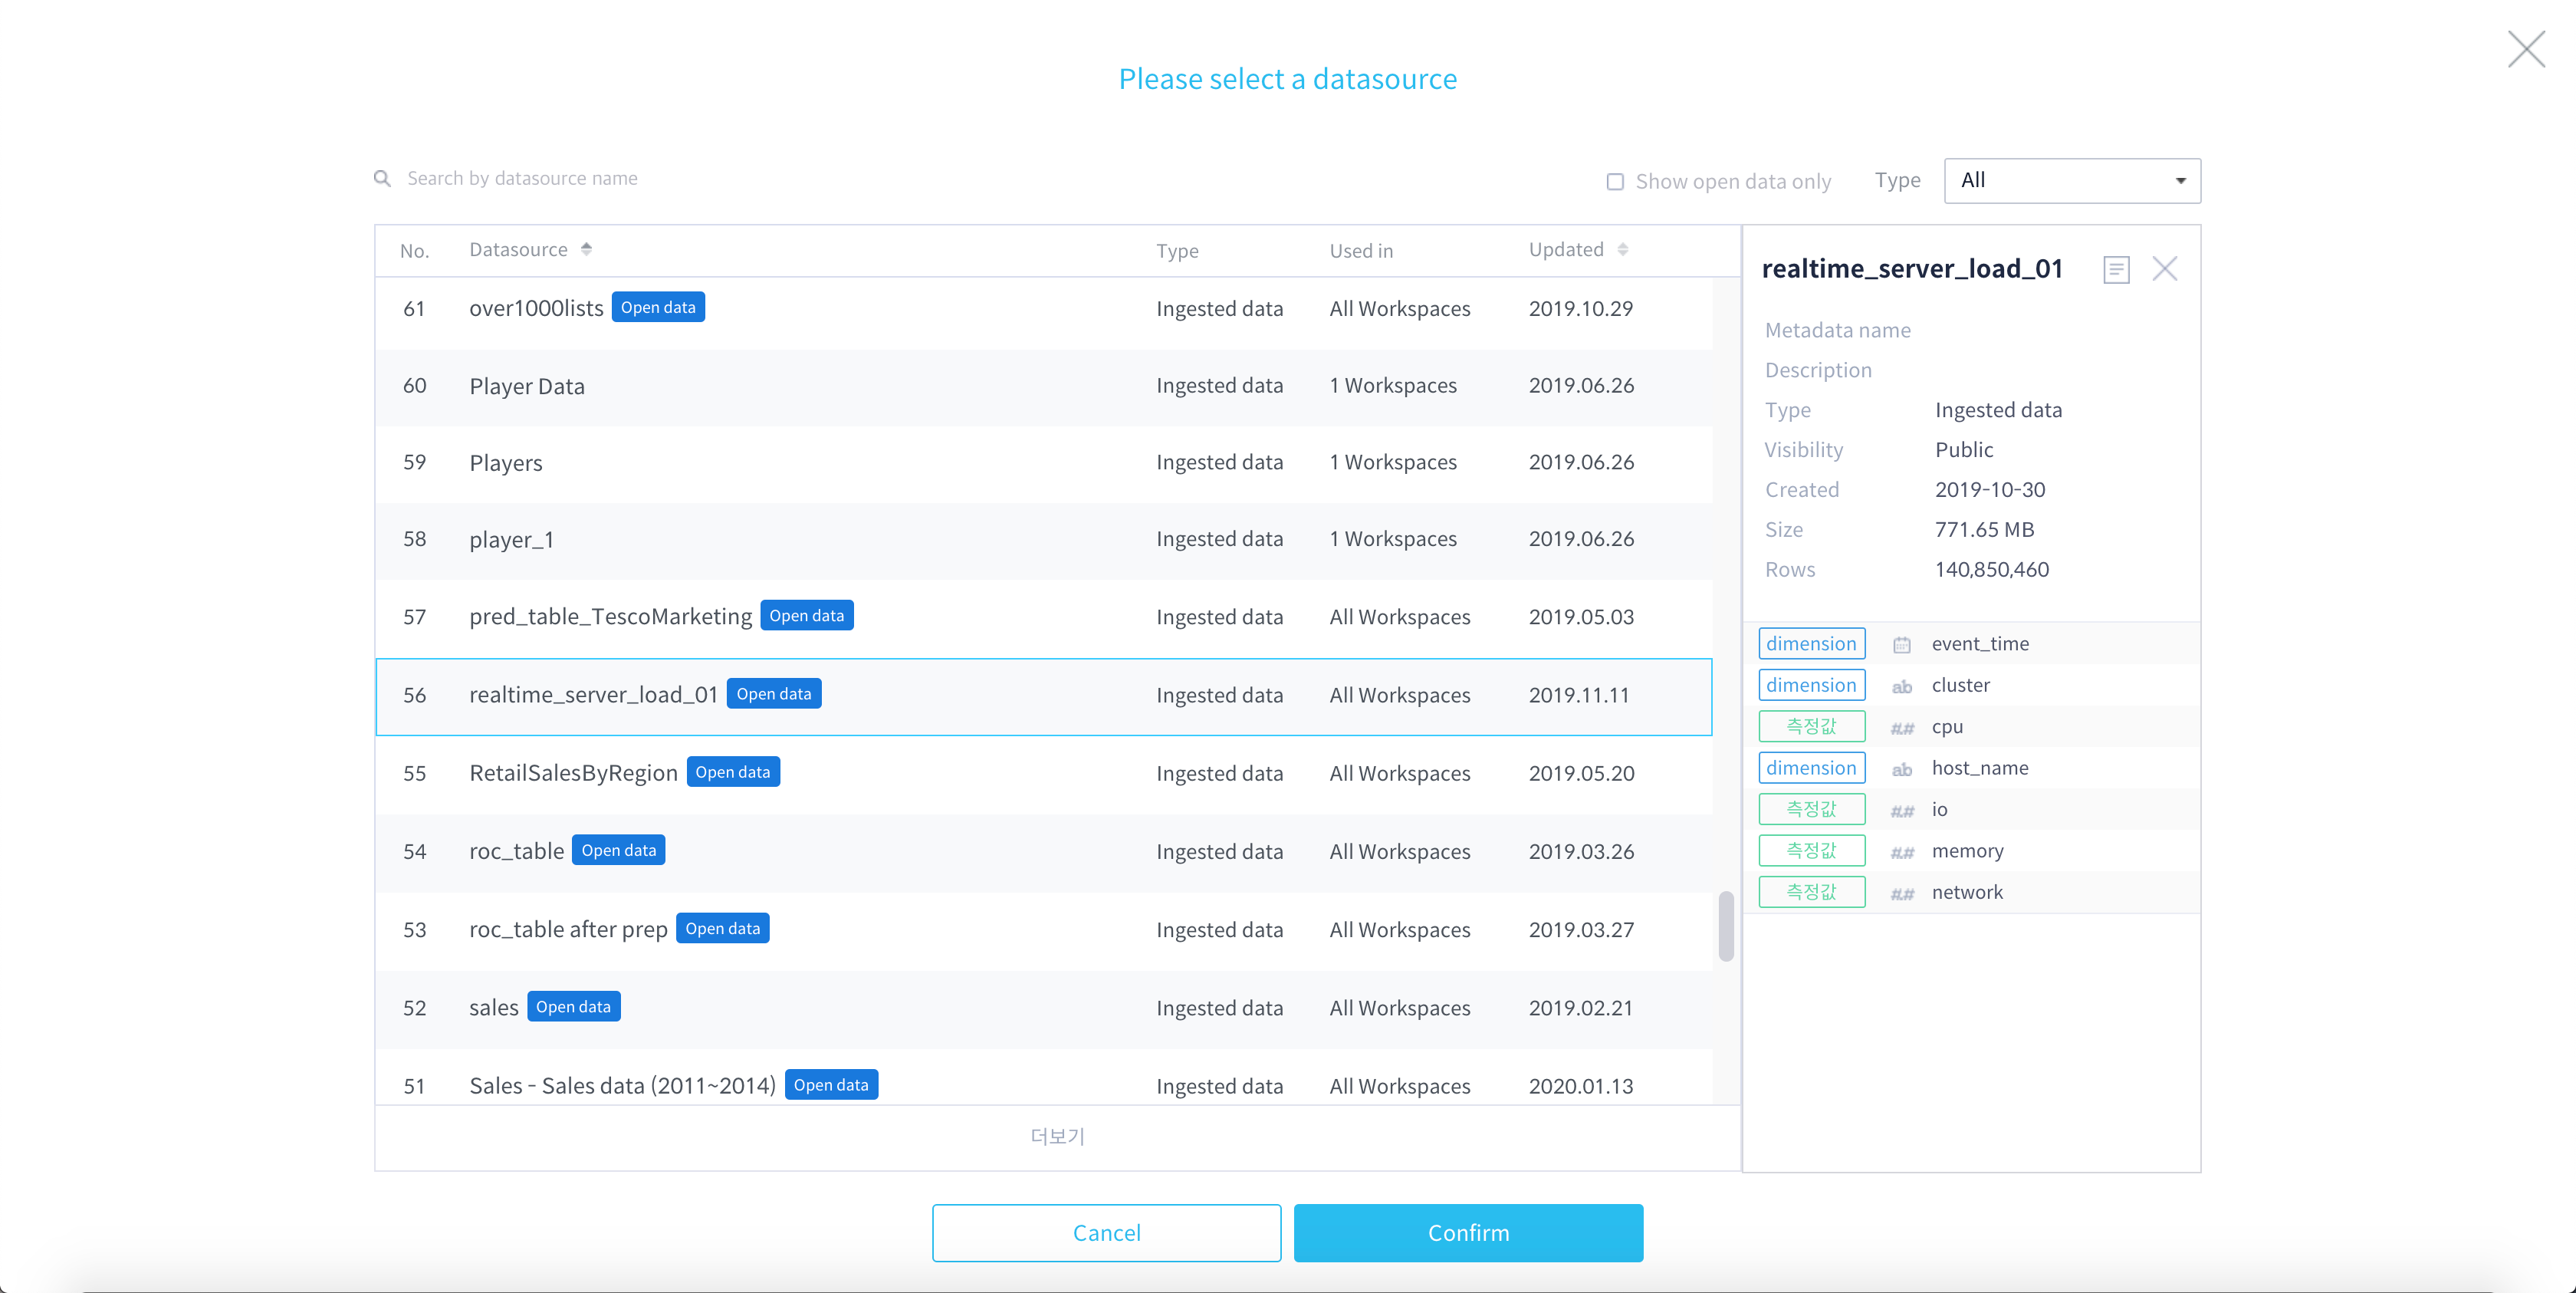
When you first access the search menu, you must first select a data source. The selected data source is retained even if you navigate to a different screen until you change to a different data source.
Click the data source select button at the bottom.
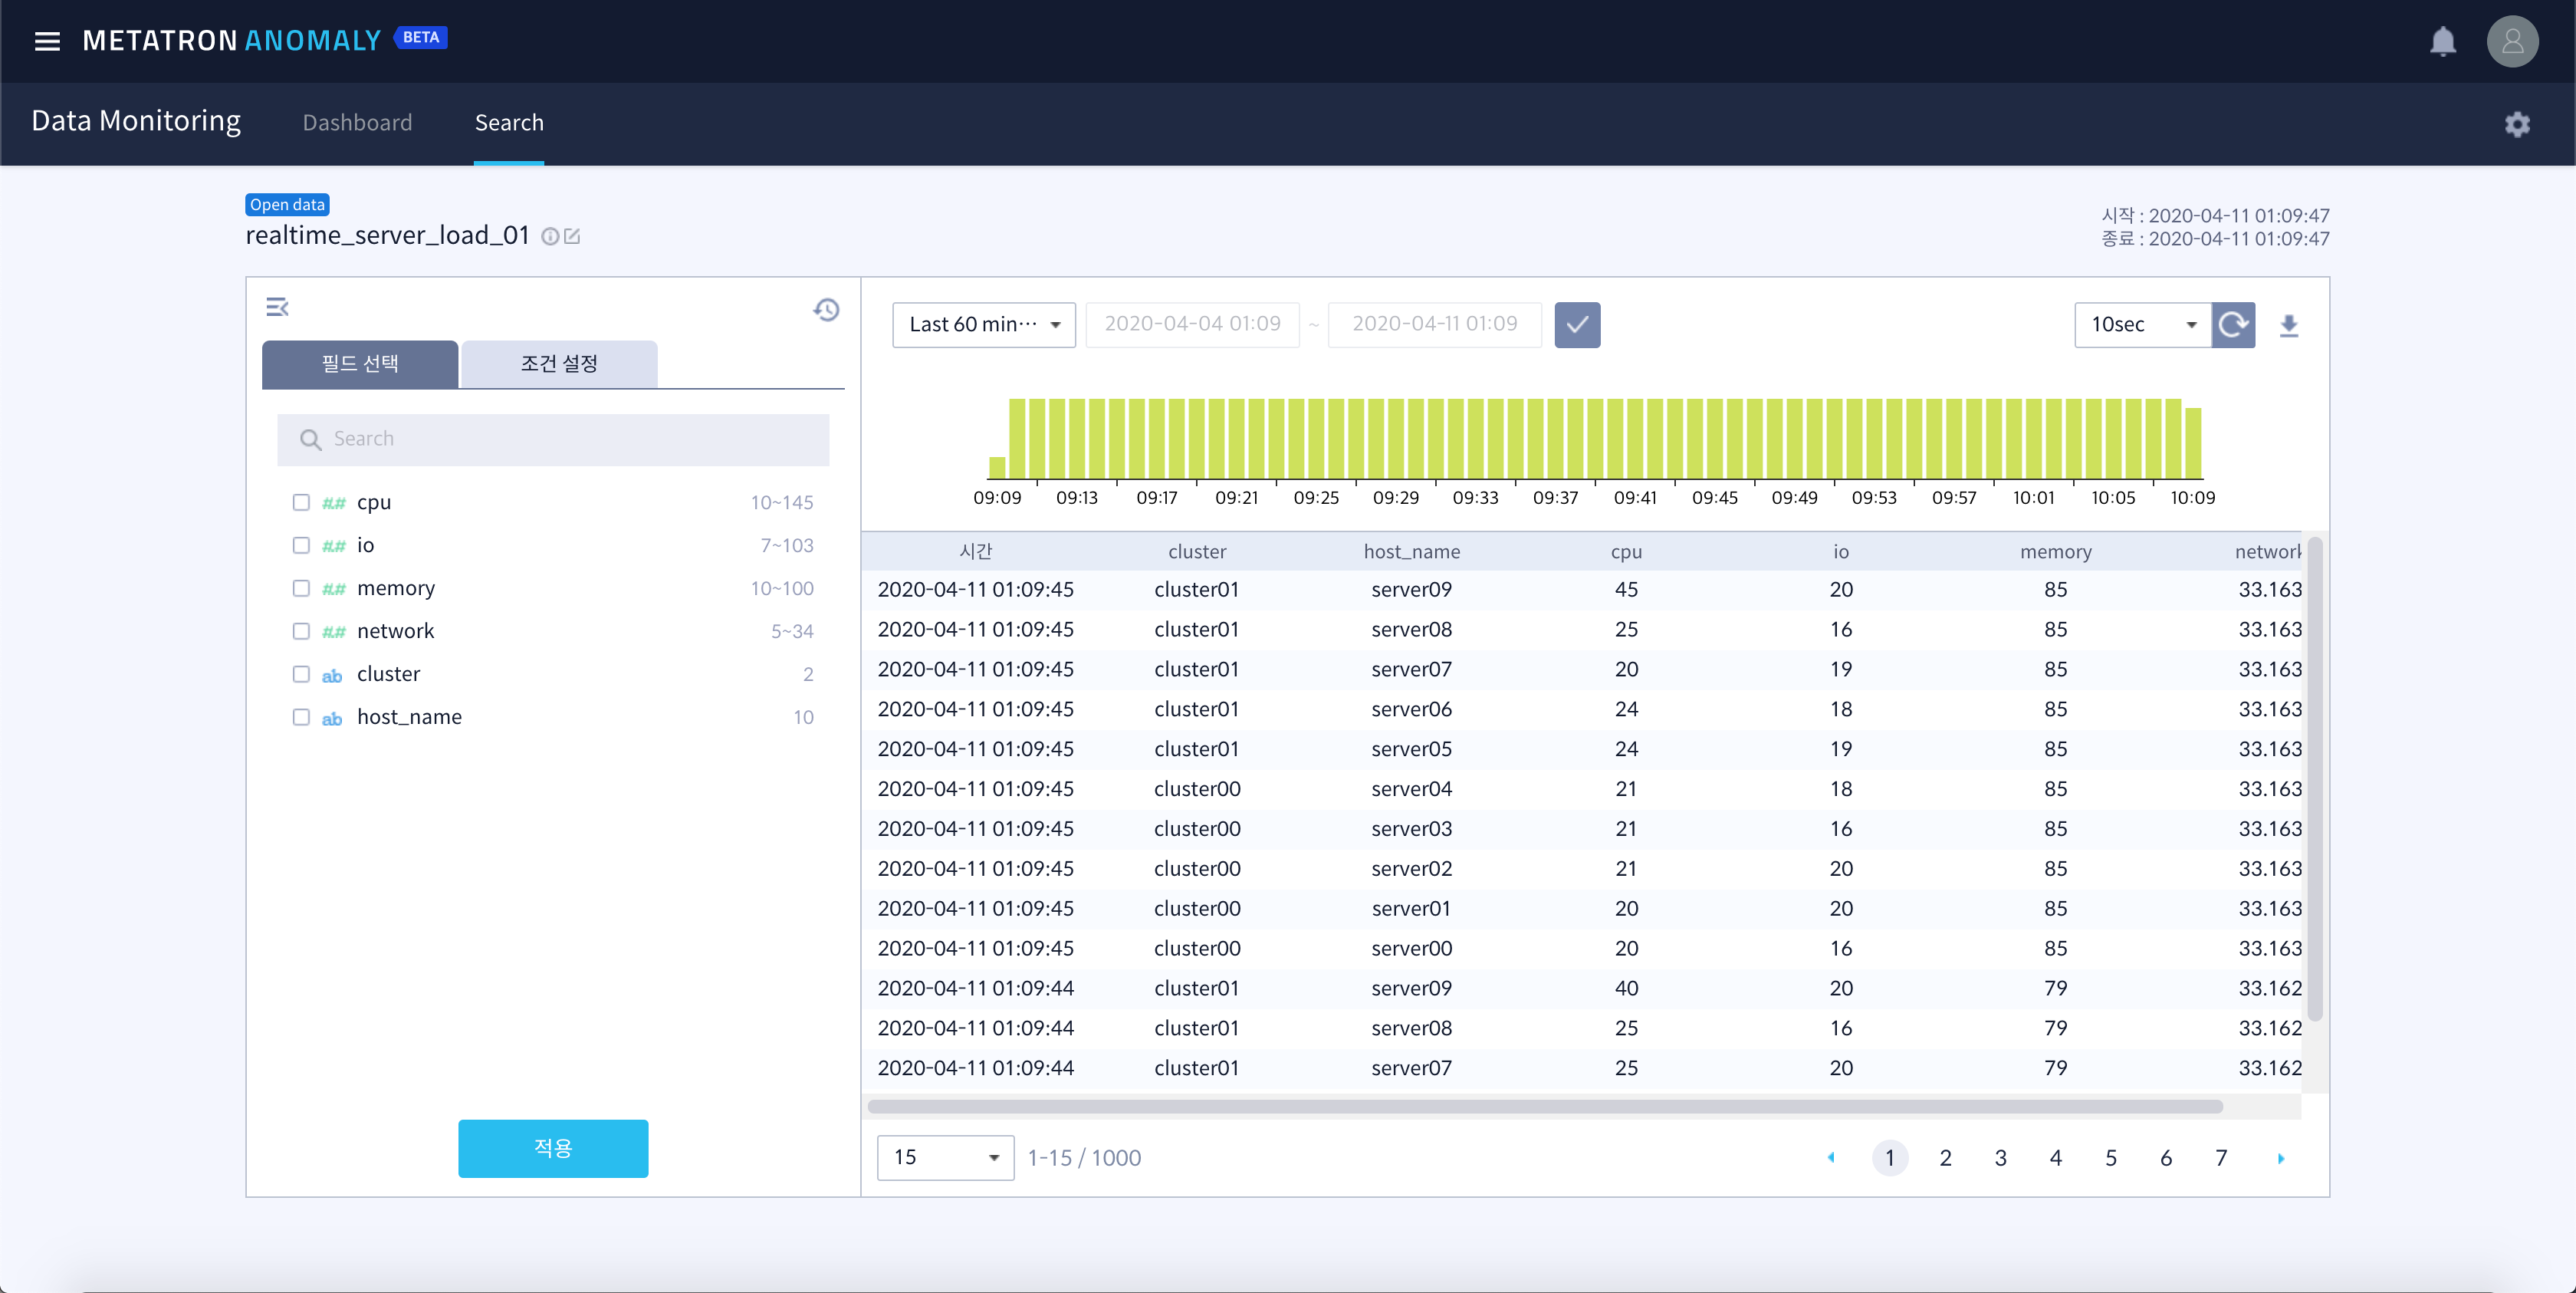
When a data source is selected, the result values for the entire field are queried by default. The query period is set differently depending on the data source collection time unit.
Choosing Fields & Conditions
Select fields
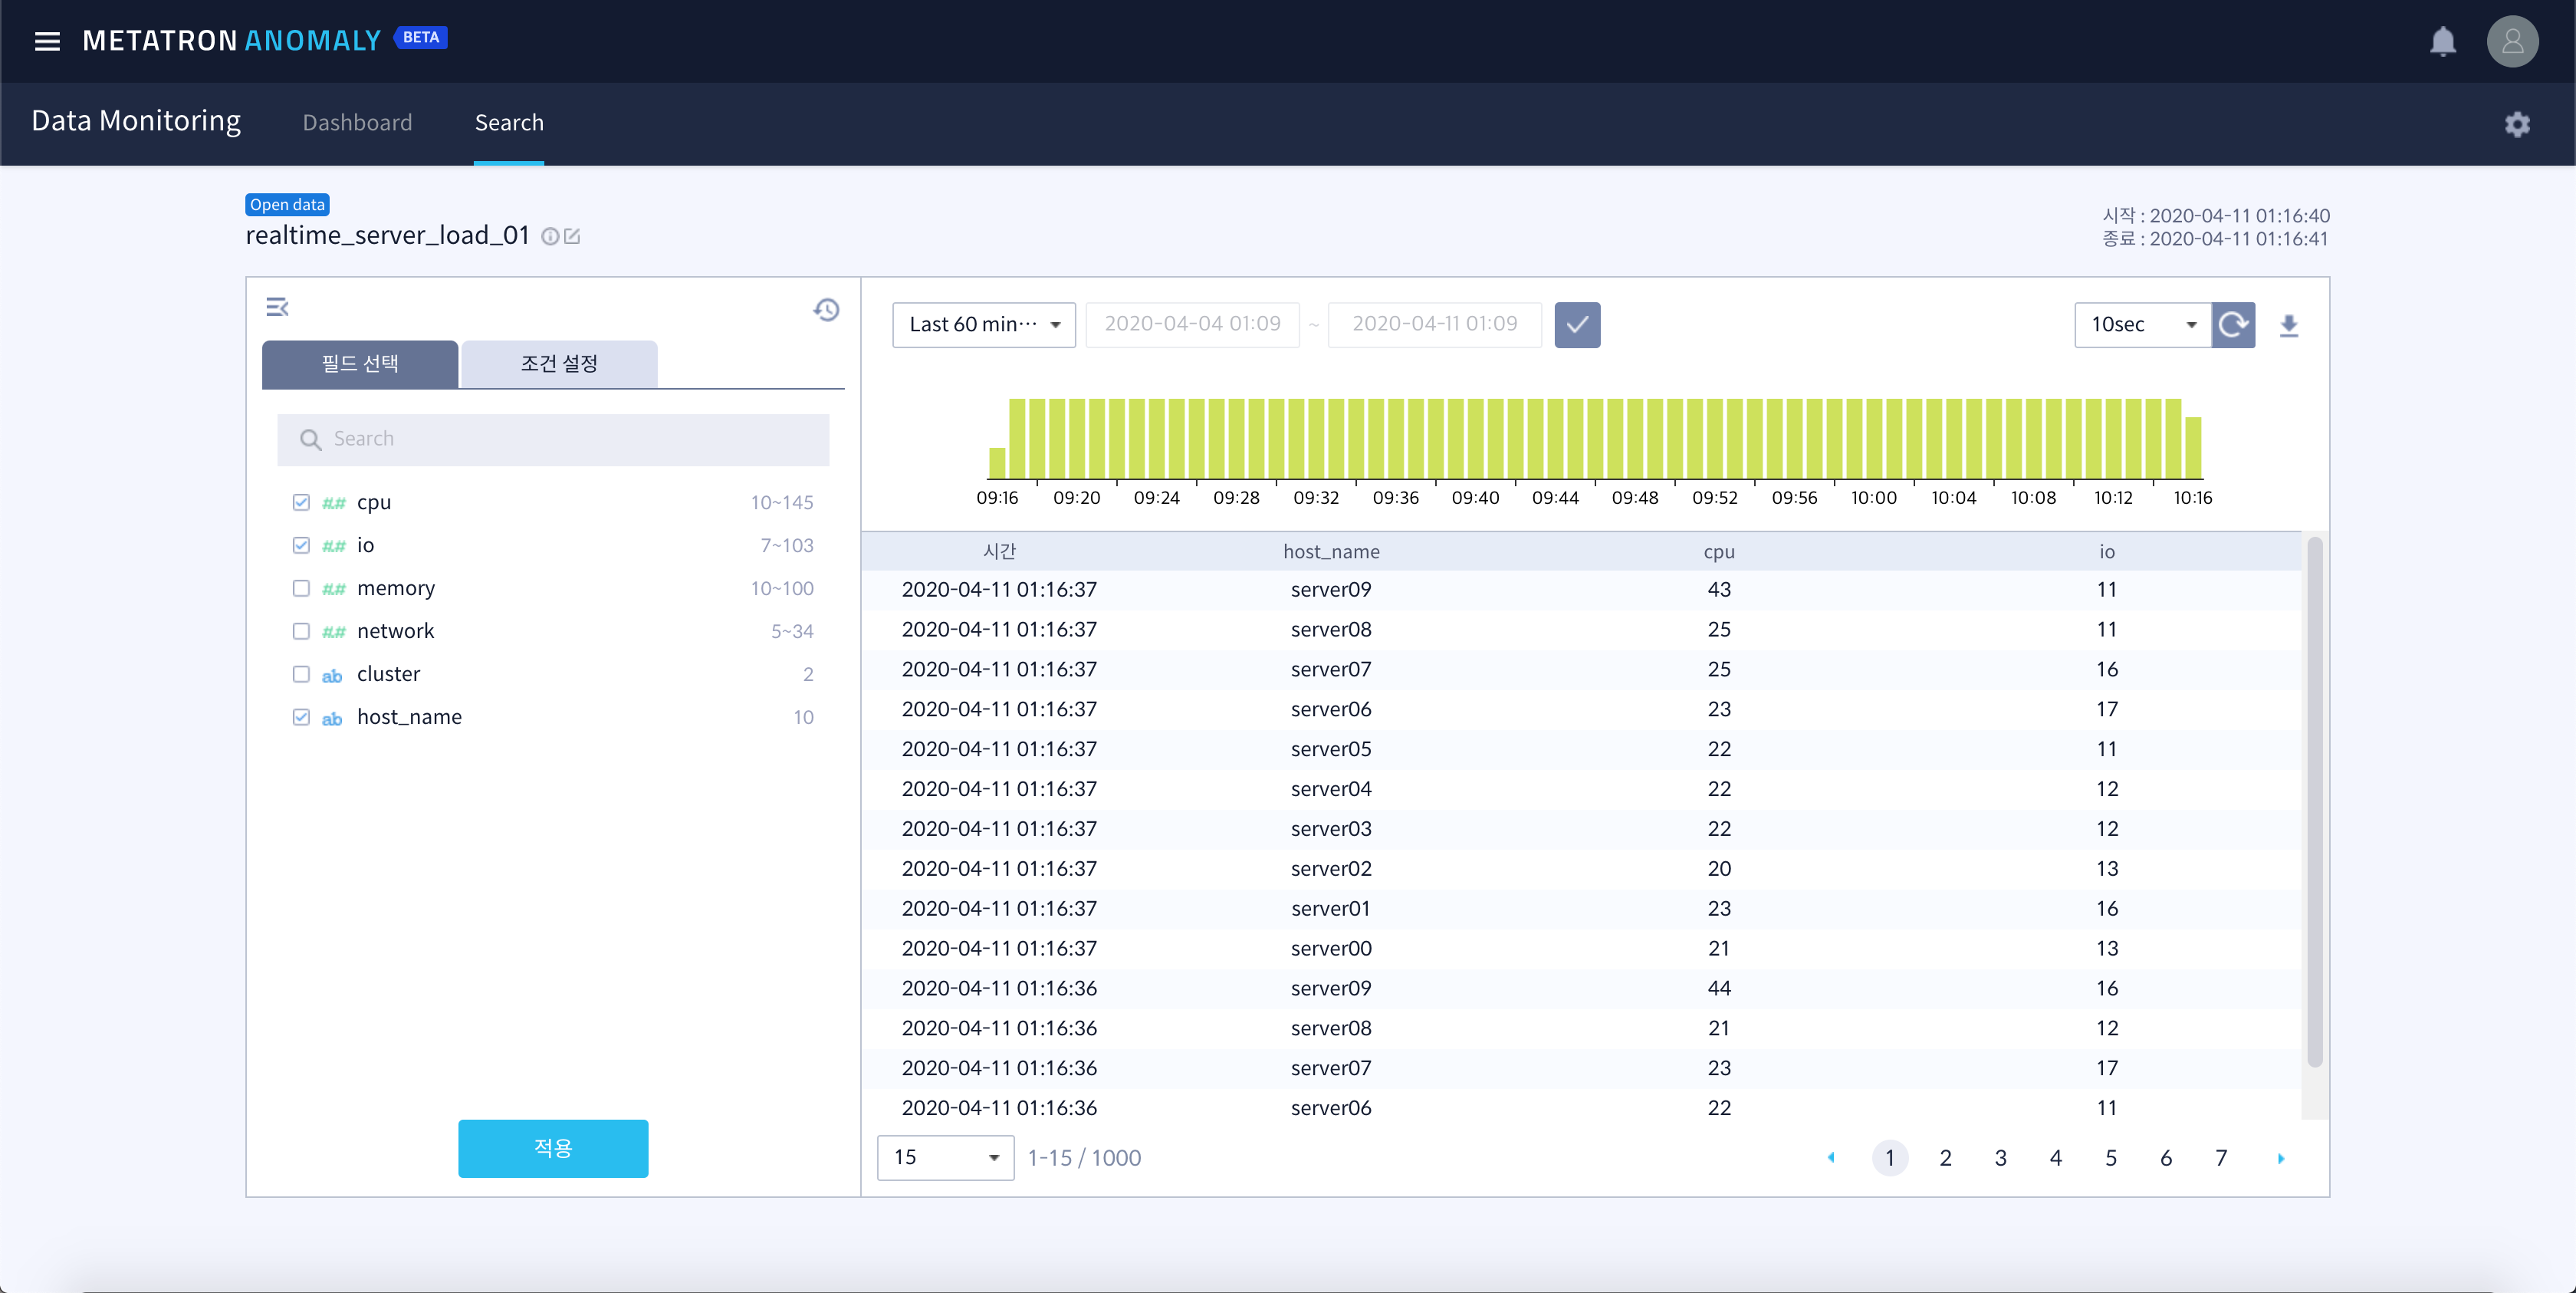
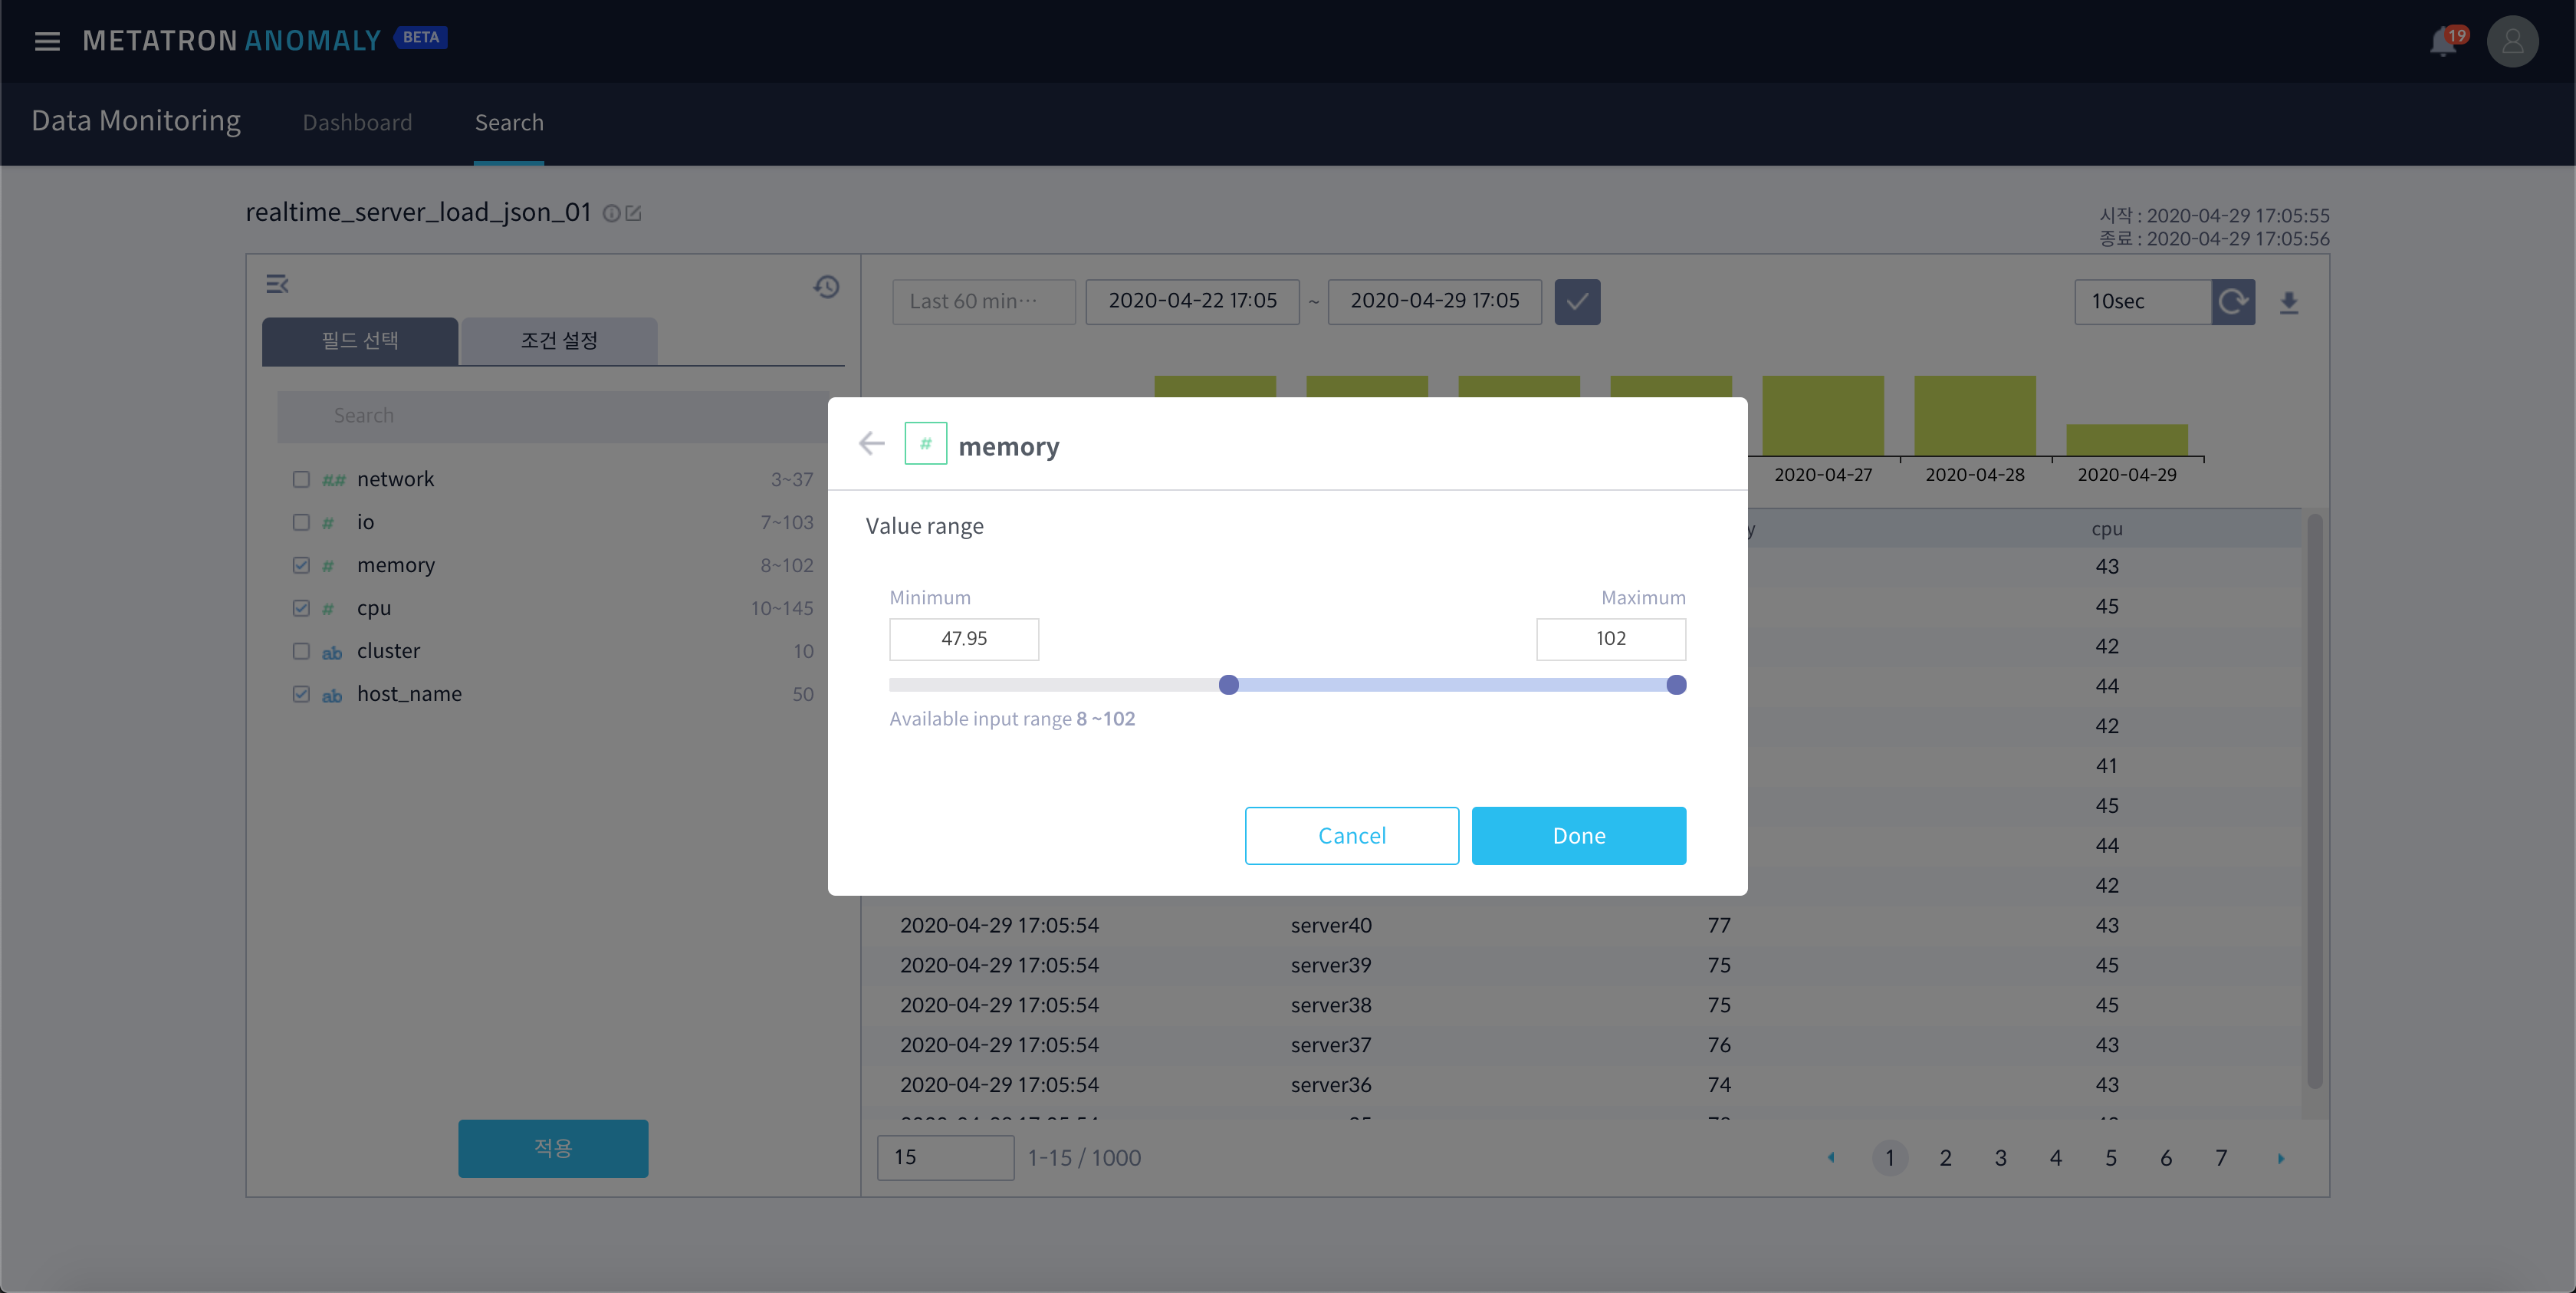
To the right of each field value is the range of values for a measure and the number of values for a dimension. If you select the field you want to search and click Apply, you can search only for the corresponding field value.
The number to the right of the field name means the range of each column value or the number of eigenvalues.
If the column is Measure, the number on the right means the range of the minimum value to the maximum value of the column.
If the column is Dimension, the number on the right means the number of eigenvalues of the column.
If you click the number to the right of the field name, you can quickly filter for the column, and the added filter can be checked in the condition setting tab.
Condition setting
You can set the search condition for each field in detail by using condition setting tab. We provide a easy UI that enables system operators and business users who cannot write data inquiry query to easily set complex conditions to search data.
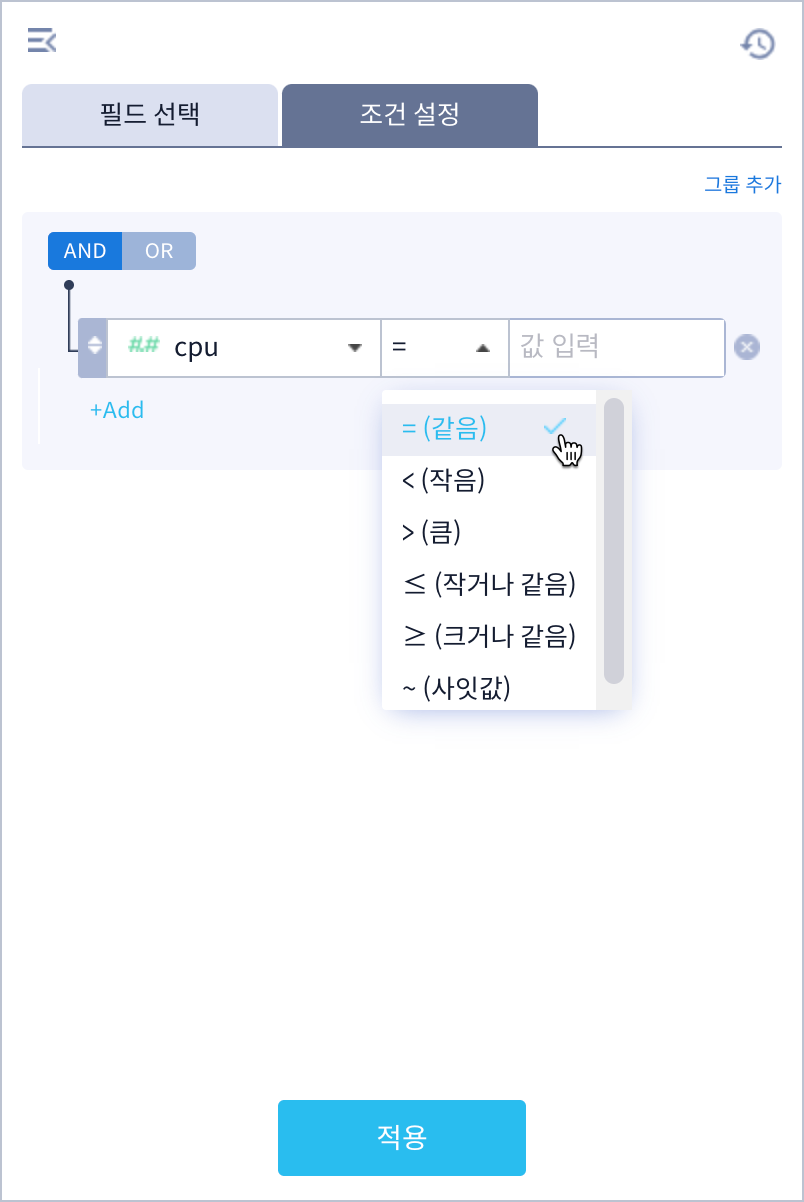
Conditional expressions for individual field values can set up an and / or relationship with each other, and by adding a group at the top, you can also set up an and / or relationship between groups.
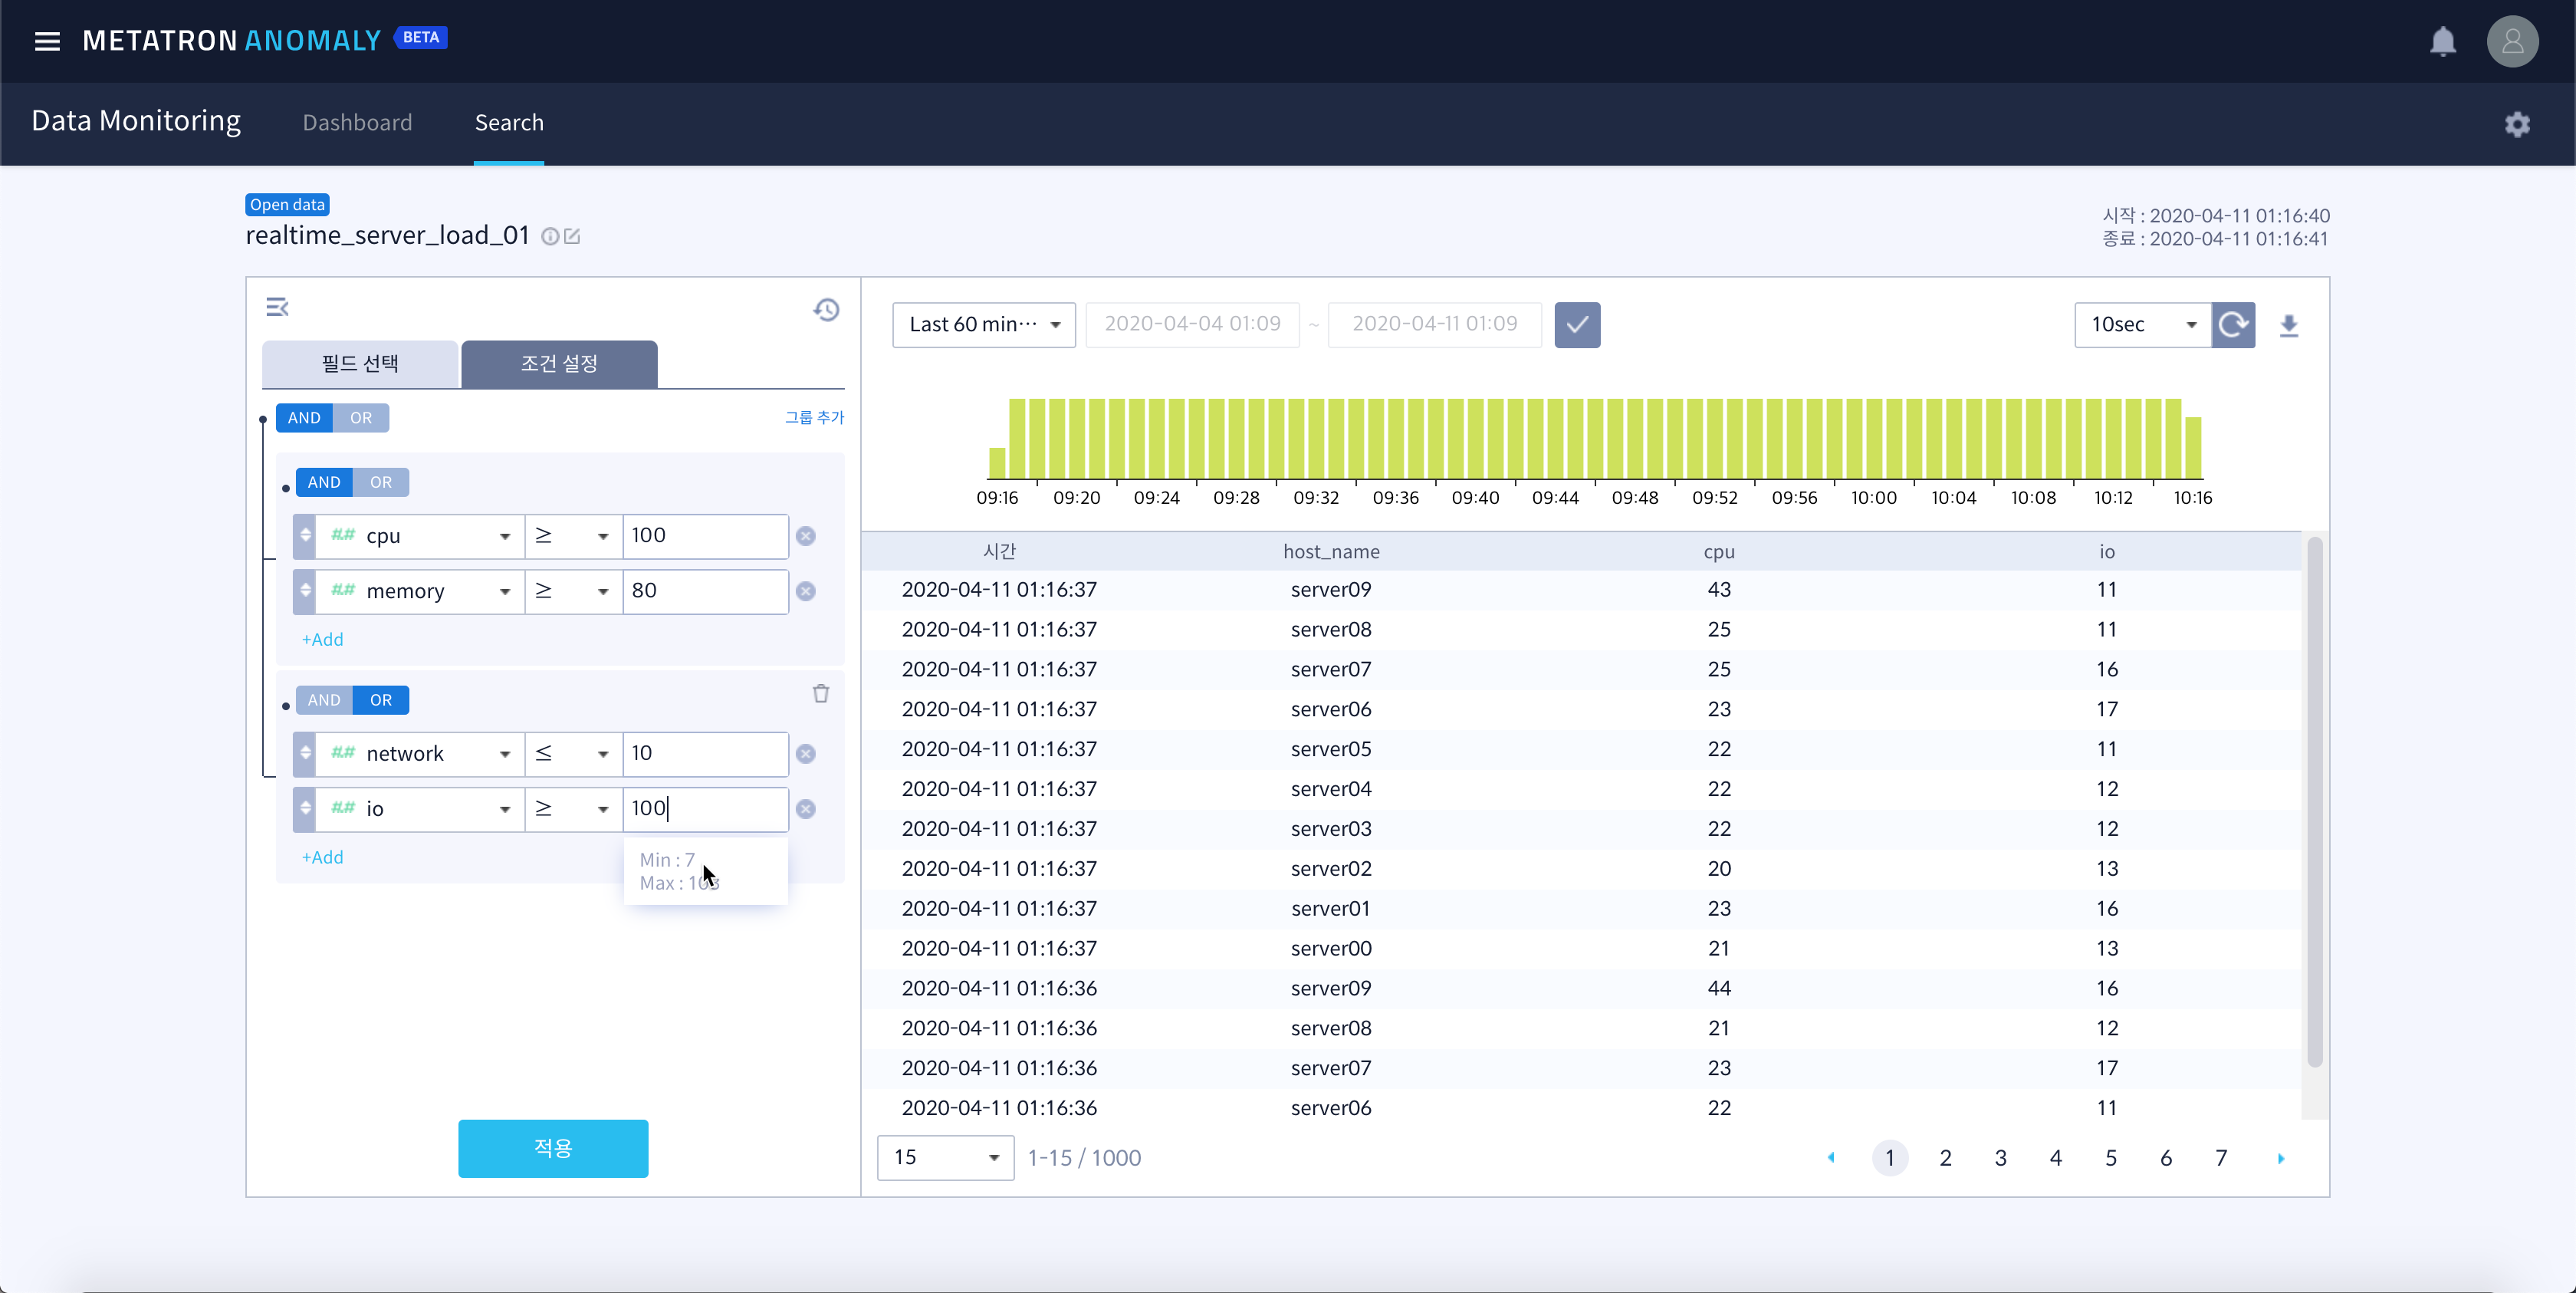
There are six comparison operators provided for measure field conditional expressions:
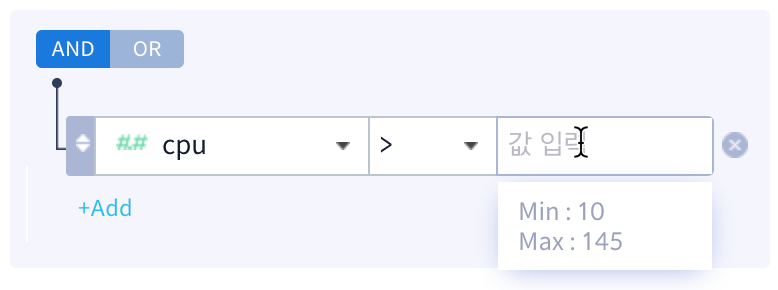
When the cursor is entered in the condition input field for the measure value, the minimum and maximum values are displayed as a tooltip. You can enter the conditional expression by referring to the corresponding value.
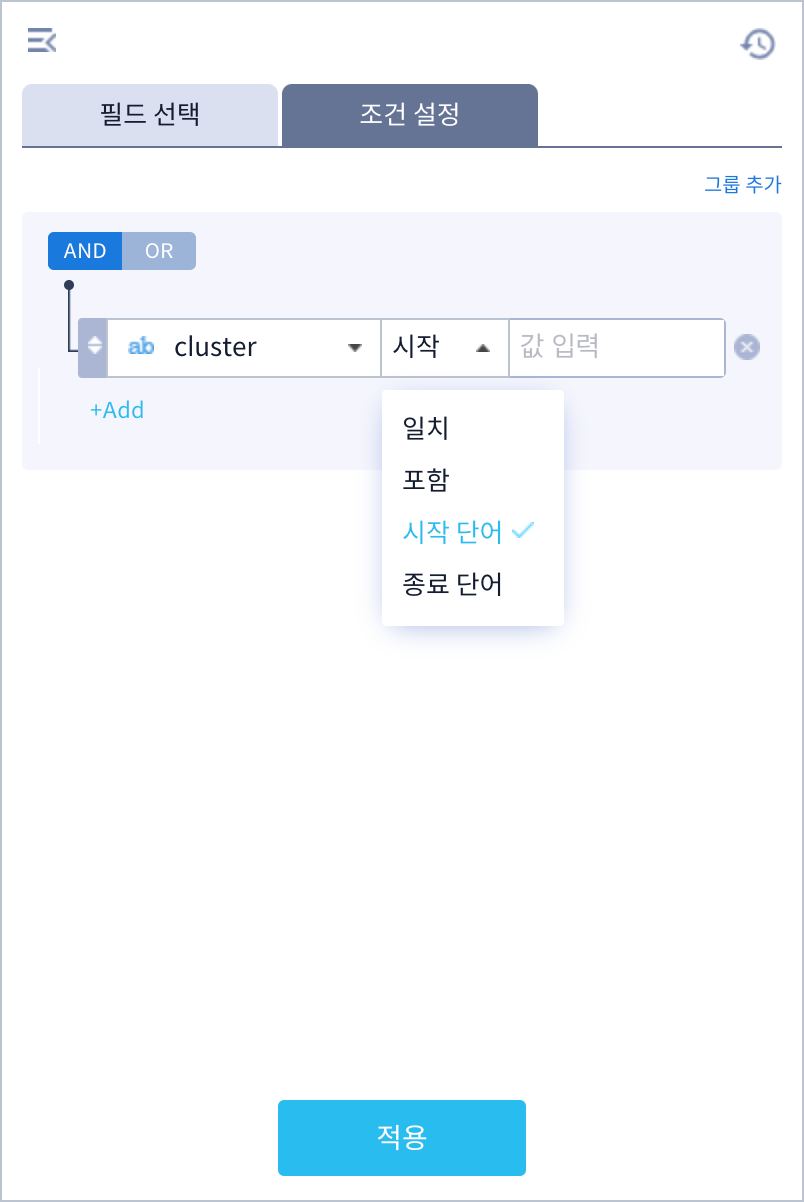
There are four operators provided for dimension value field conditional expressions:
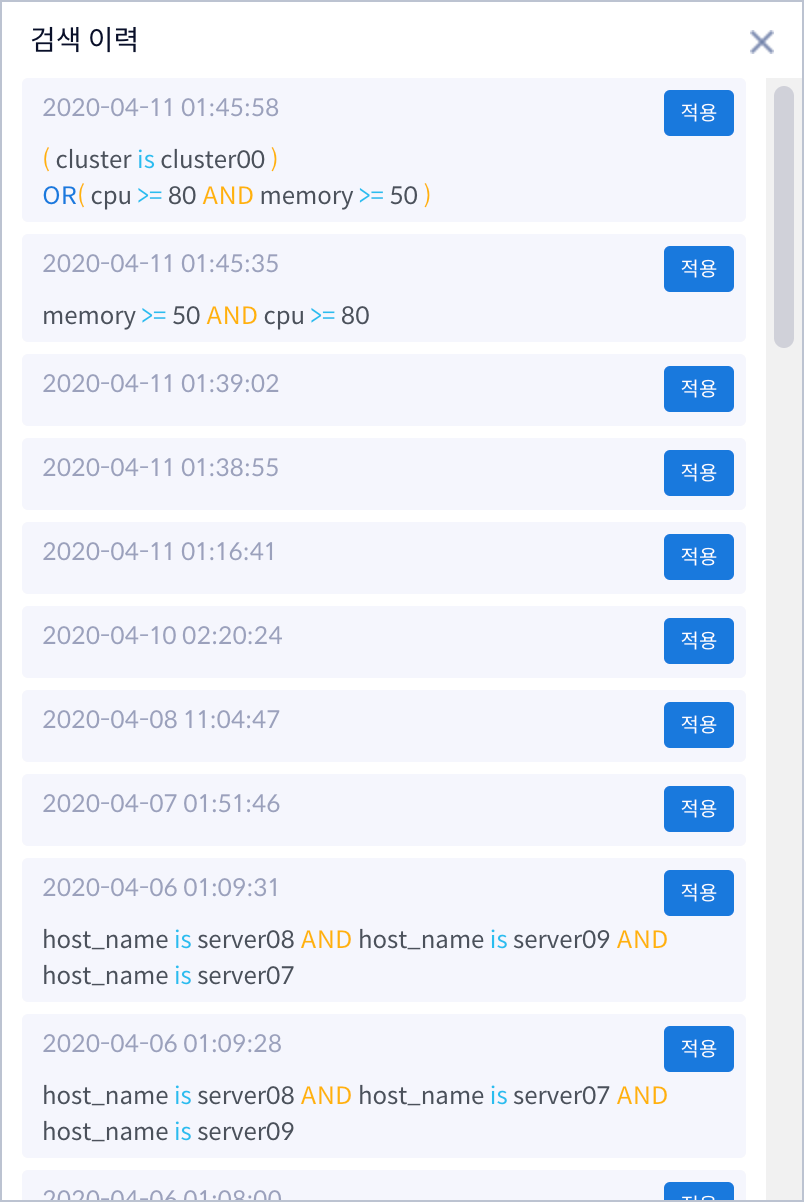
All search histories can be searched for the data source by clicking
. Search time, search condition, etc. can be inquired for each search history, and clicking Apply on the right will inquire data with the same conditions.
Search Result
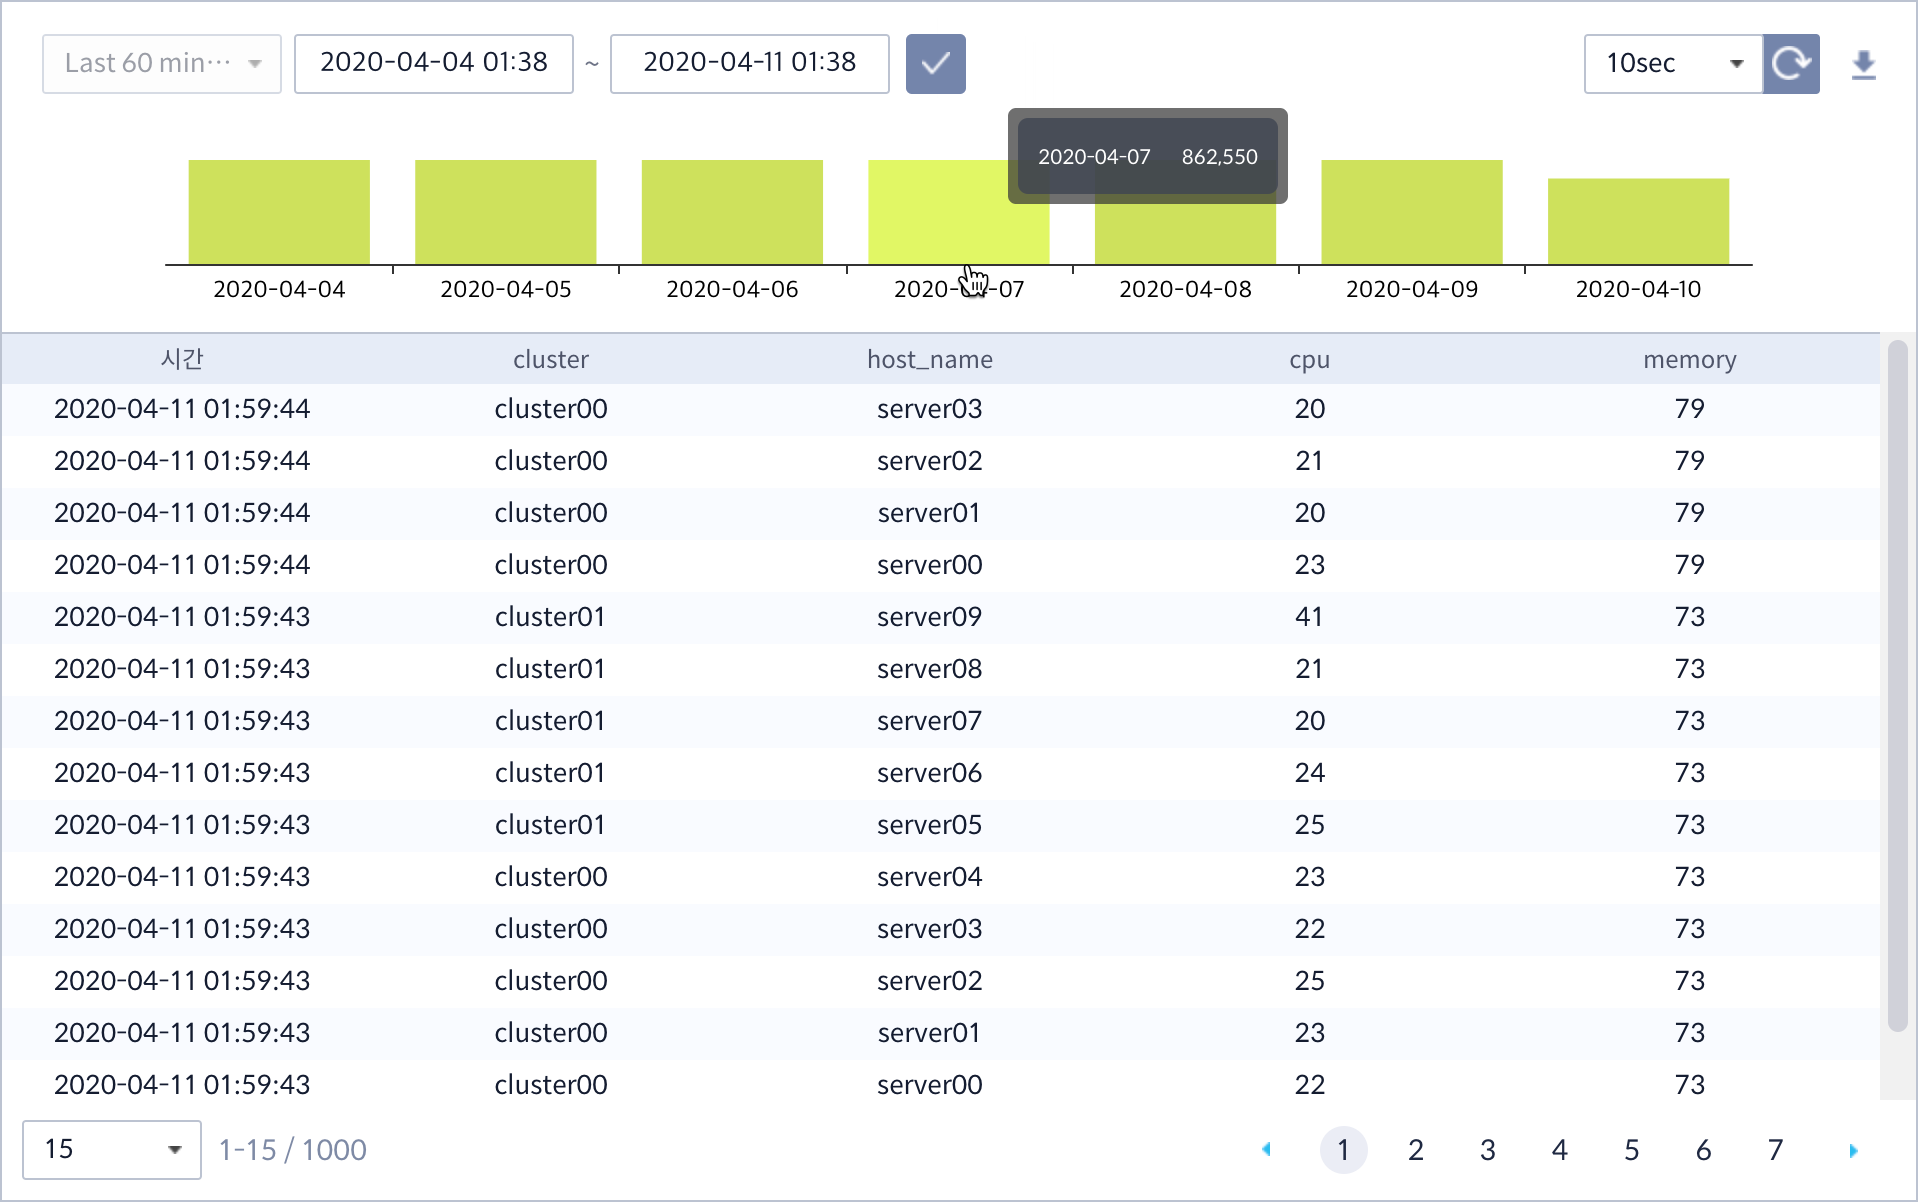
Set inquiry period: You can set the data range to be searched at the top of the search result window. You can select the time period relative to the current time from the drop-down menu or specify a time range.
Auto update of search results: If you click the
button on the right, the search results are updated at 10 second intervals to support inquiries for new incoming data. The update cycle can be changed to 3 seconds, 30 seconds or 60 seconds, and clicking
again can stop the update.
Download Excel file: If you click
, Excel type file(.xls) is downloaded on your local PC.
Histogram : This is a bar chart that measures the number of data per unit of time the data is stored.
Change the number of a list item : The maximum number of data records to be viewed at one time is 1000, and the number of records to be displayed on one page can be changed to 15, 30, or 50 in the drop-down menu at the bottom.
