Alarm
In the Alarm tab menu, you can check the alarm history that has occurred so far. Unlike the: ref: Statistics page, which shows the overall status of the alarm, this menu provides an optimized UI for viewing and browsing more individual alarms.
This tab consists of the following two pages.
Alarm List
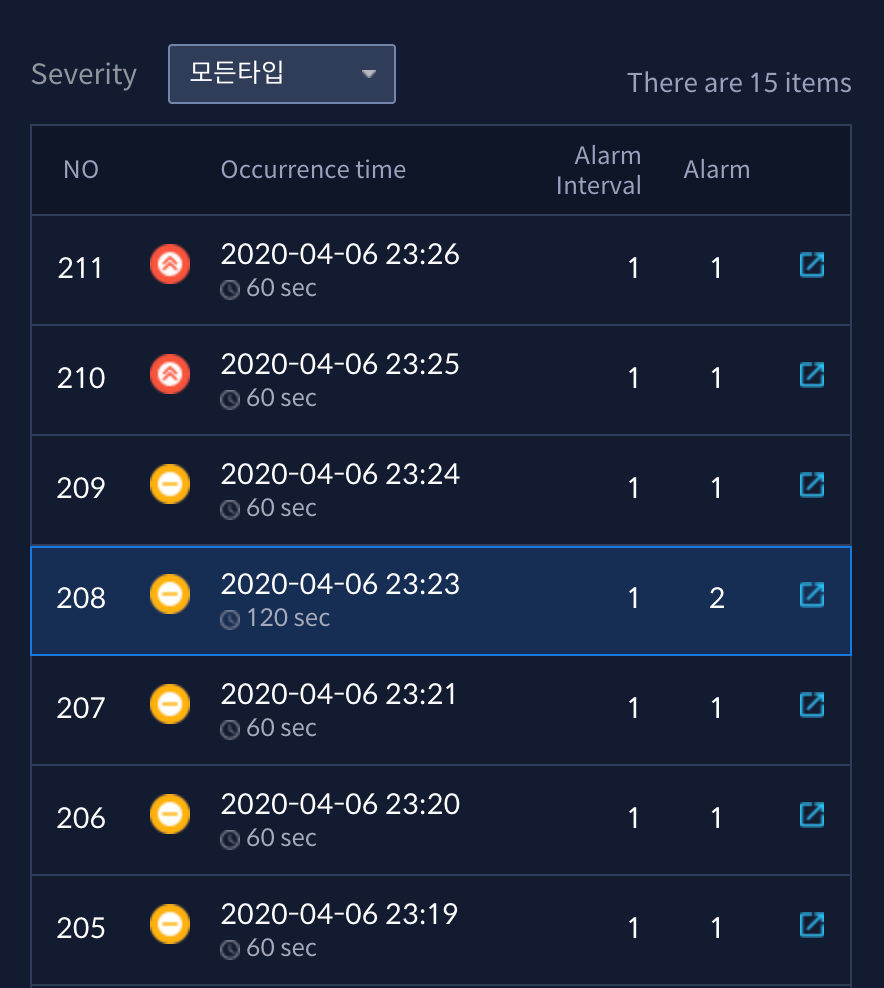
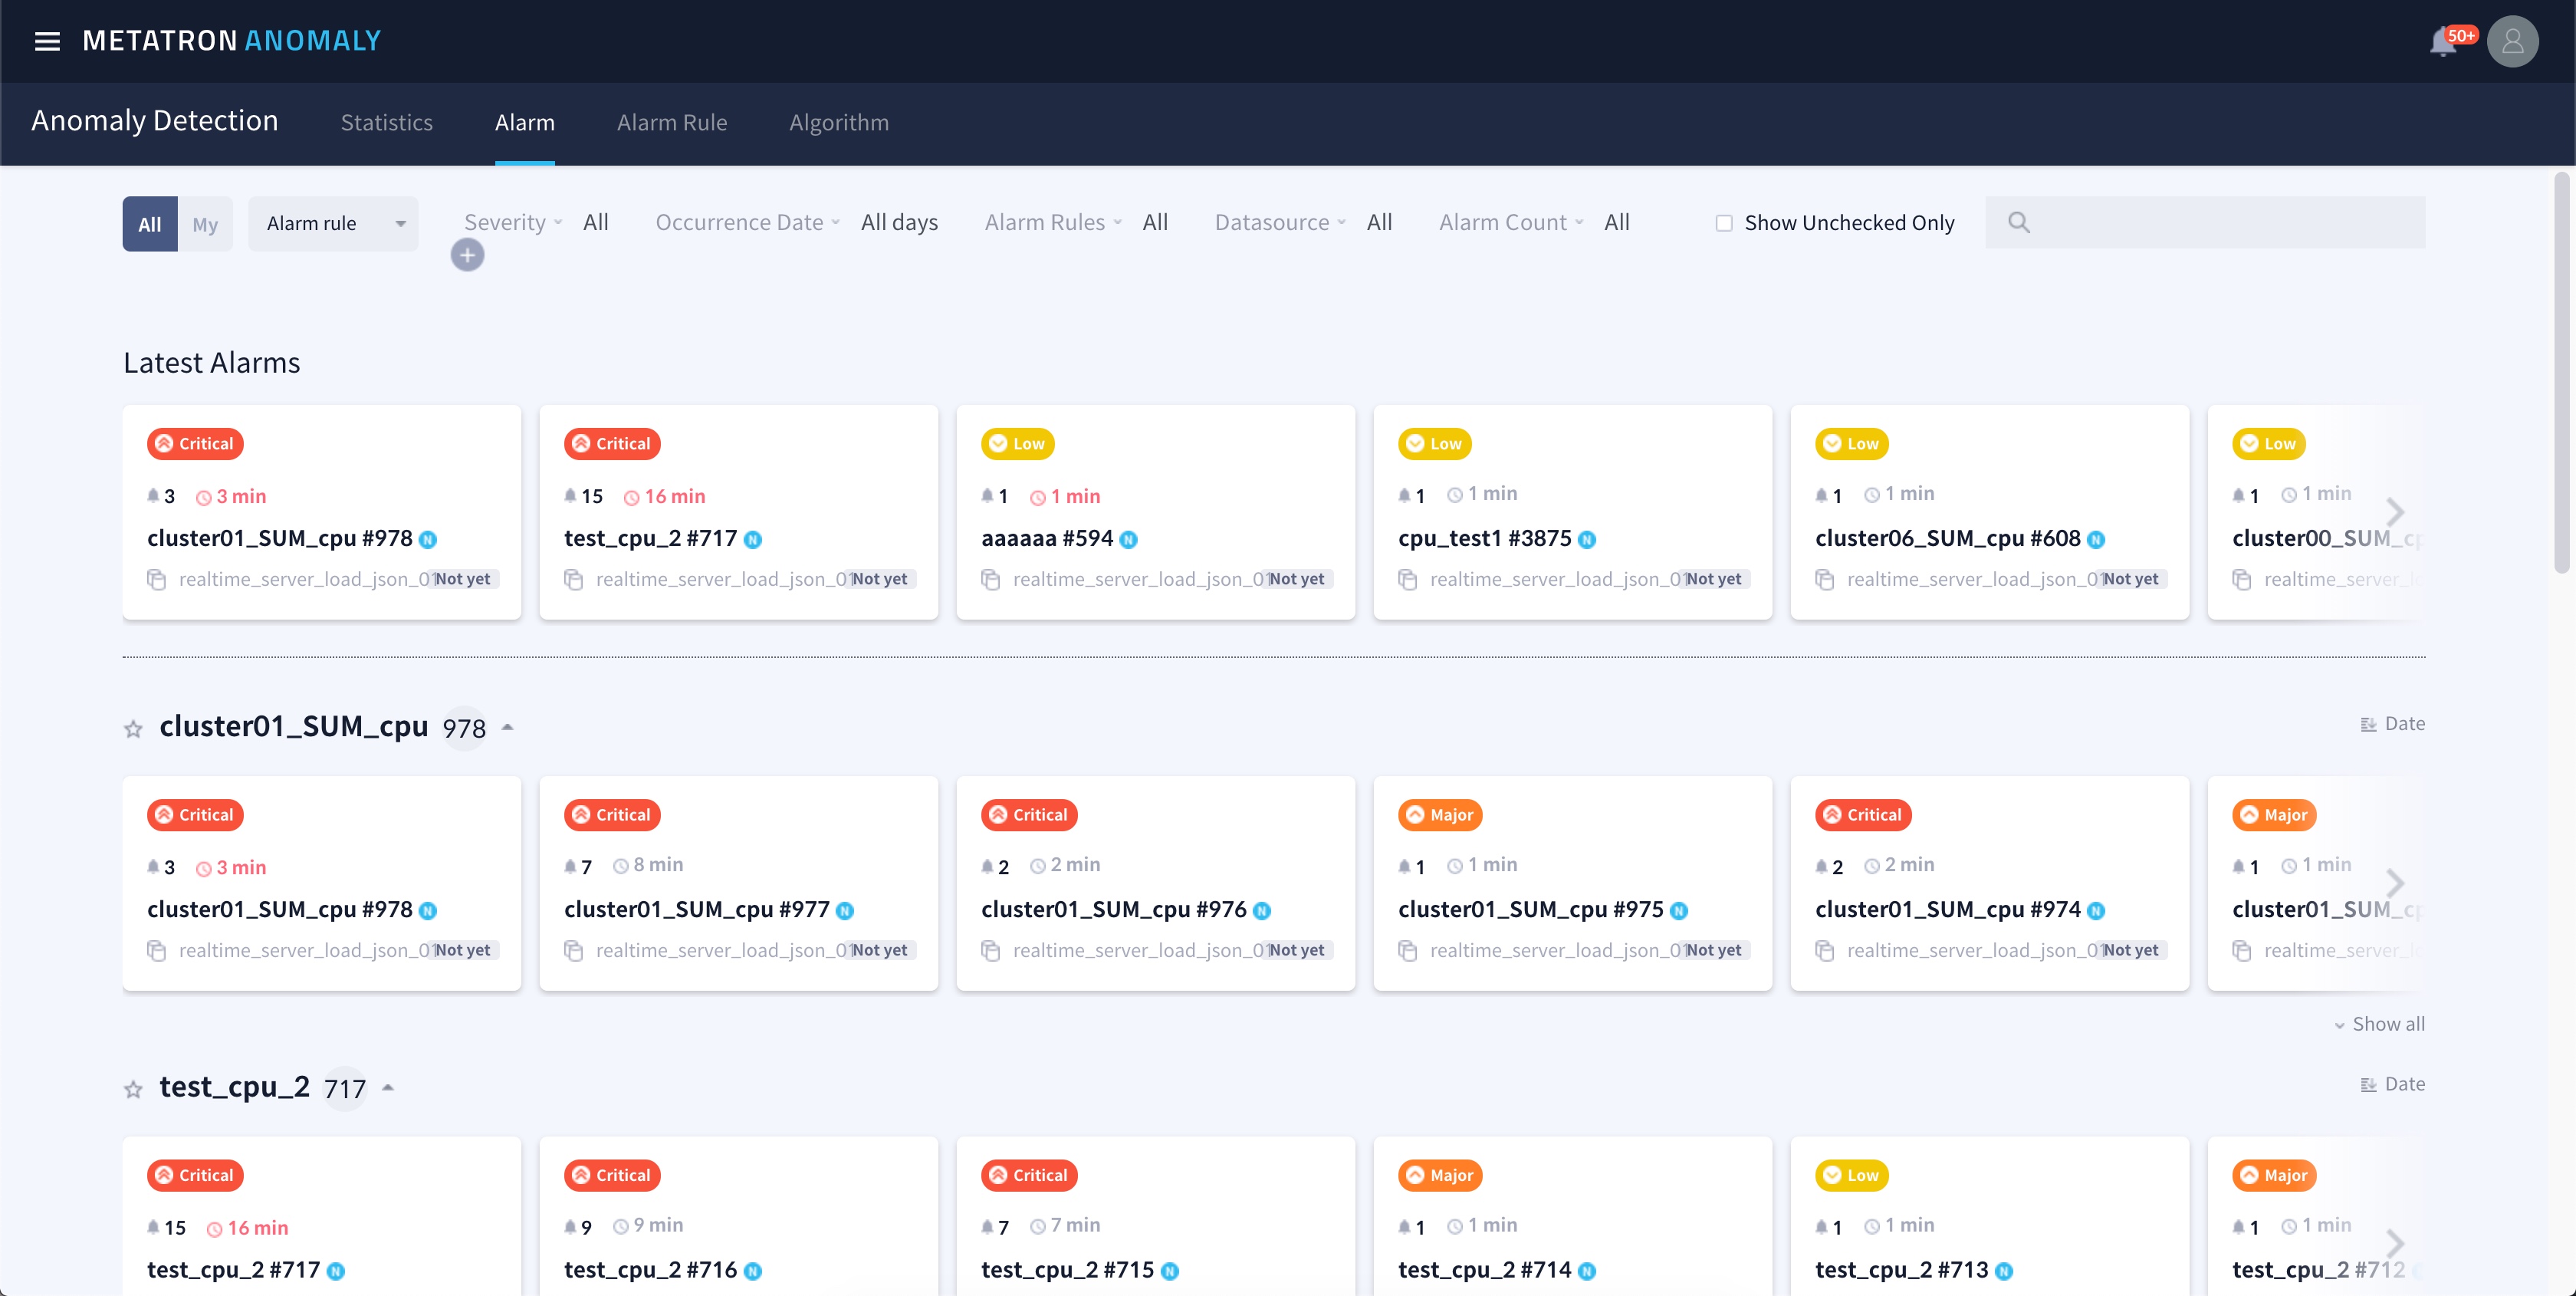
When entering the Alarm tab, the alarms that have occurred so far are listed and displayed.Using the Alarm rule / Timeline selection box at the top of the screen, you can sort the alarm list by alarm rule or by the time that occurred.
Alarm rule (sort by alarm rule)
Timeline (sort by occurrence time)
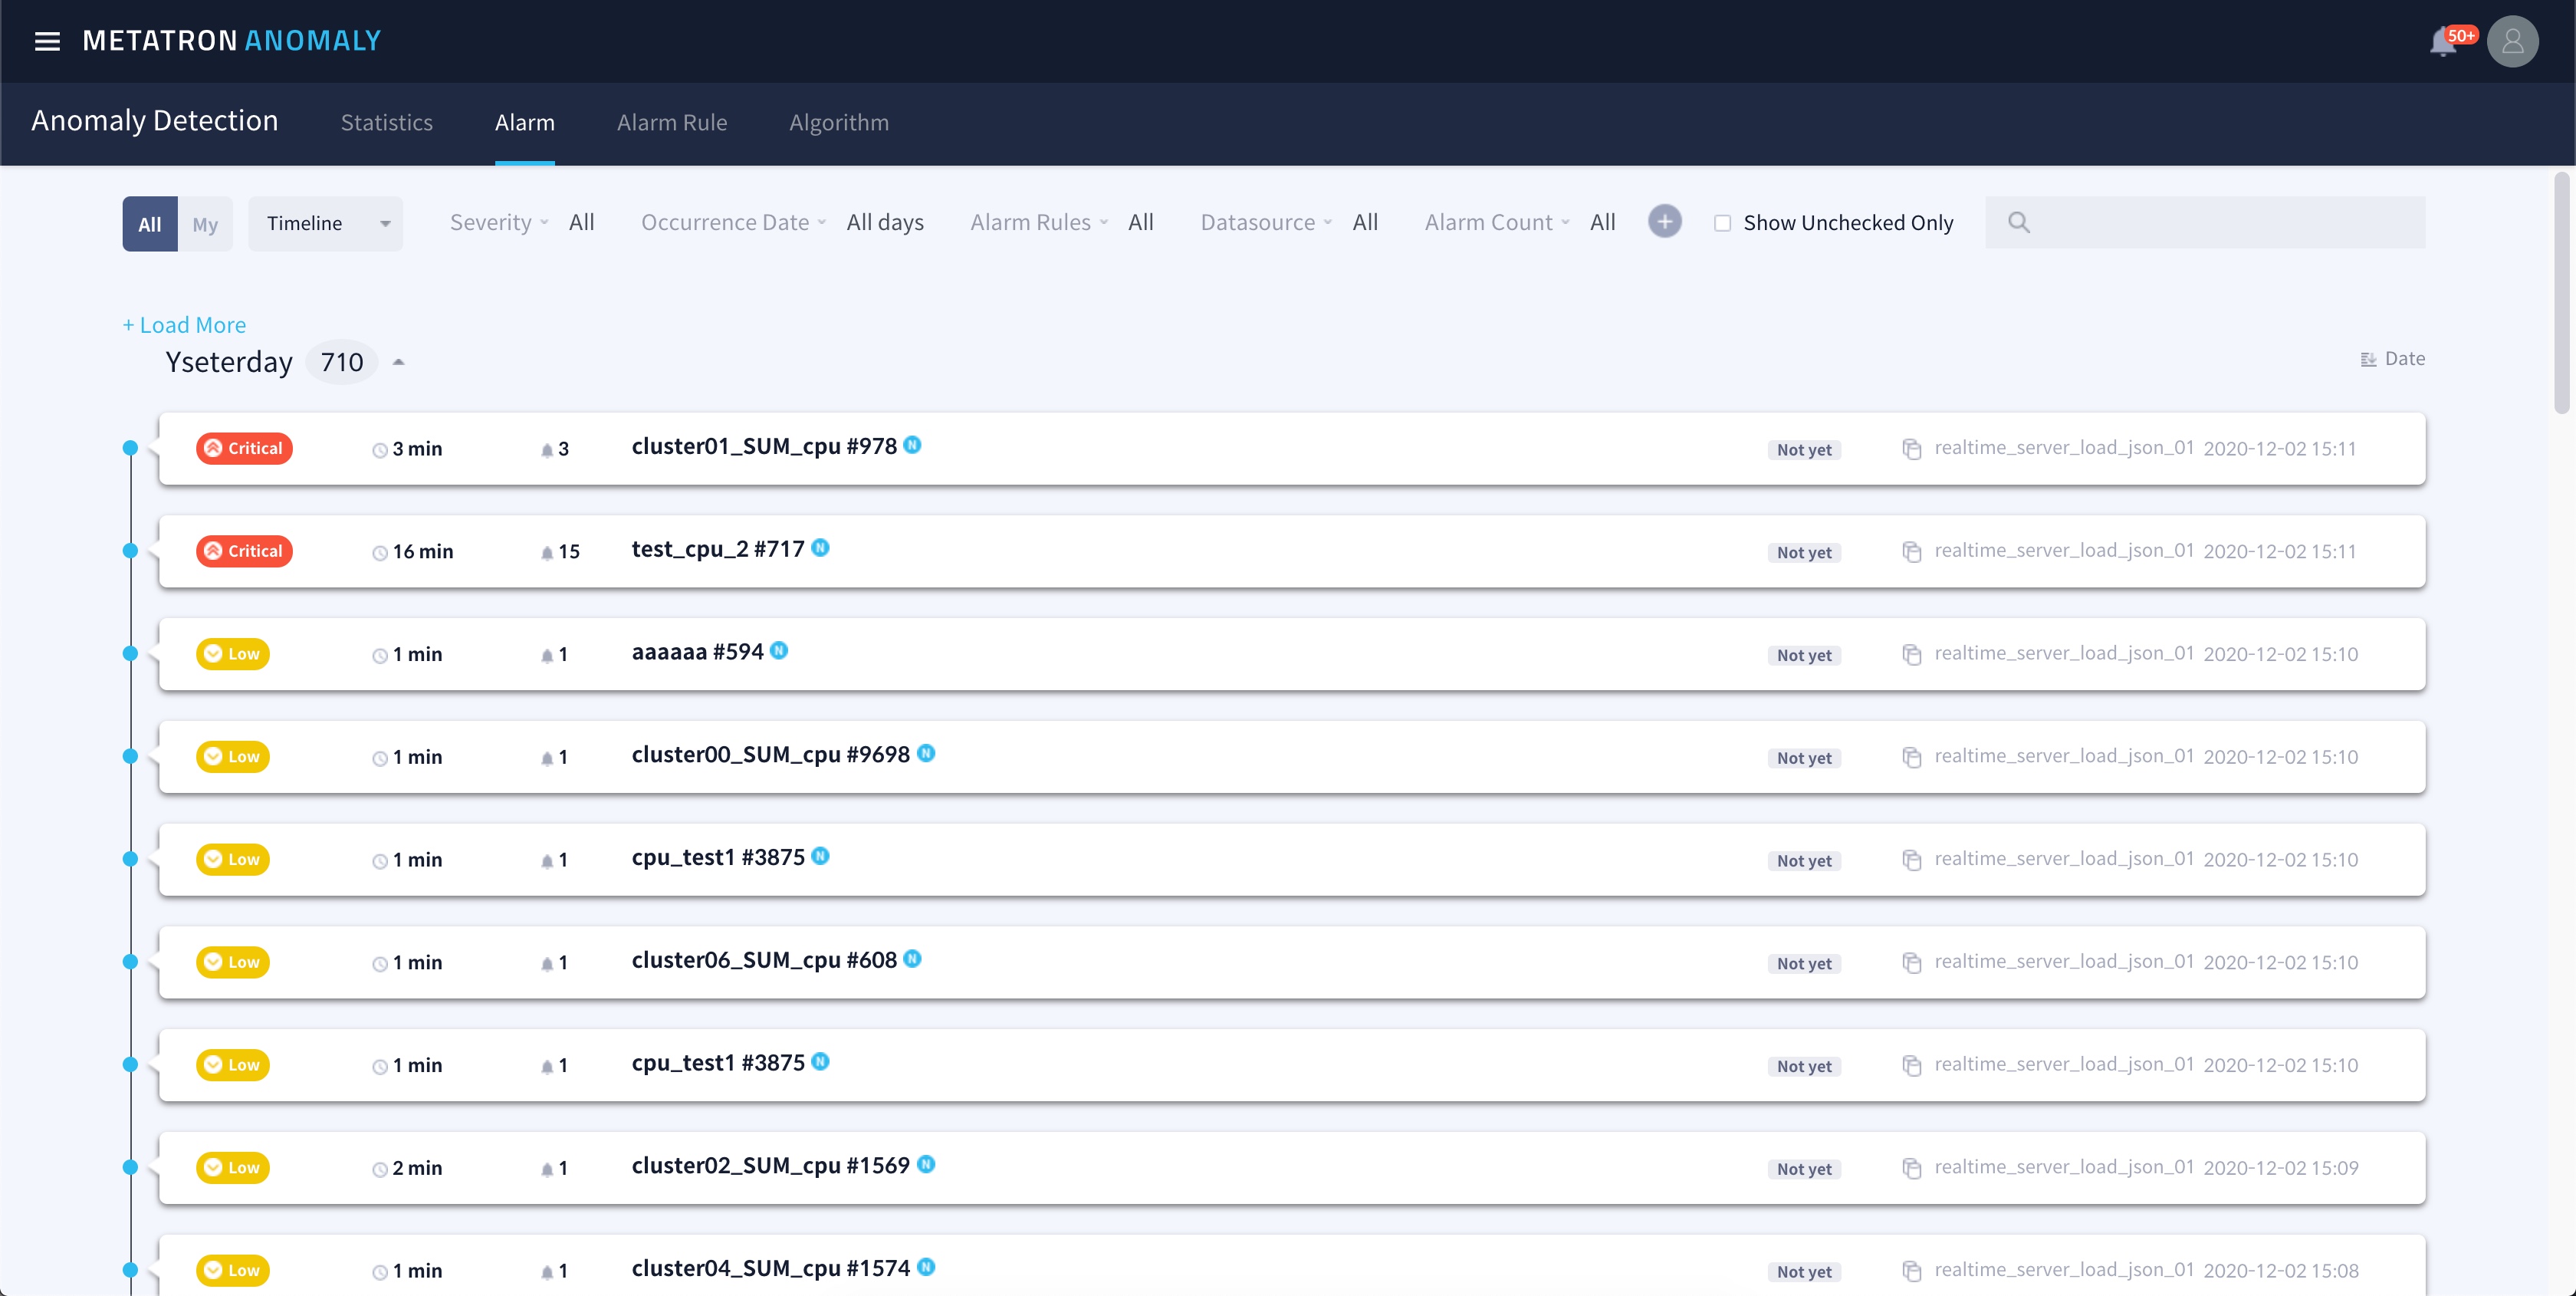
Click + Load moreat the end of a category to show more alarm entries in that category.
Alarm Details
Select one of the items listed in the alarm list to view detailed information about the alarm. Below is the description of each area of the alarm detail page.
Summary
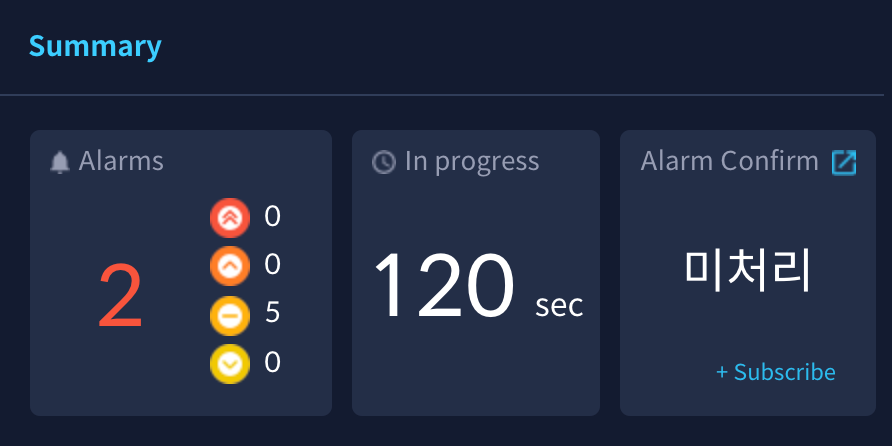
이 영역에서는 해당 알람의 발생 현황을 보여줍니다. 정해진 주기에 따라 알람이 연속적으로 발생하면 1개의 알람 항목으로 계속 유지되며, 알람의 심각도(severity) 기준을 넘은 데이터 포인트 수가 함께 표기됩니다. 또한 알람을 확인한 후 처리 결과를 기록할 수 있도록 링크를 제공합니다. 내가 생성한 알람 룰이 아닌 경우 Subscribe을 눌러 해당 알람 룰로 추후 발생한 알람들에 대해 알림을 받을 수 있습니다.
The example below shows that the alarm occurred twice in a row (Alarms), and because the alarm check interval is 1 minute, two alarms lasted for a total of 120 seconds. (Elapsed Time).
Alarm Confirmation
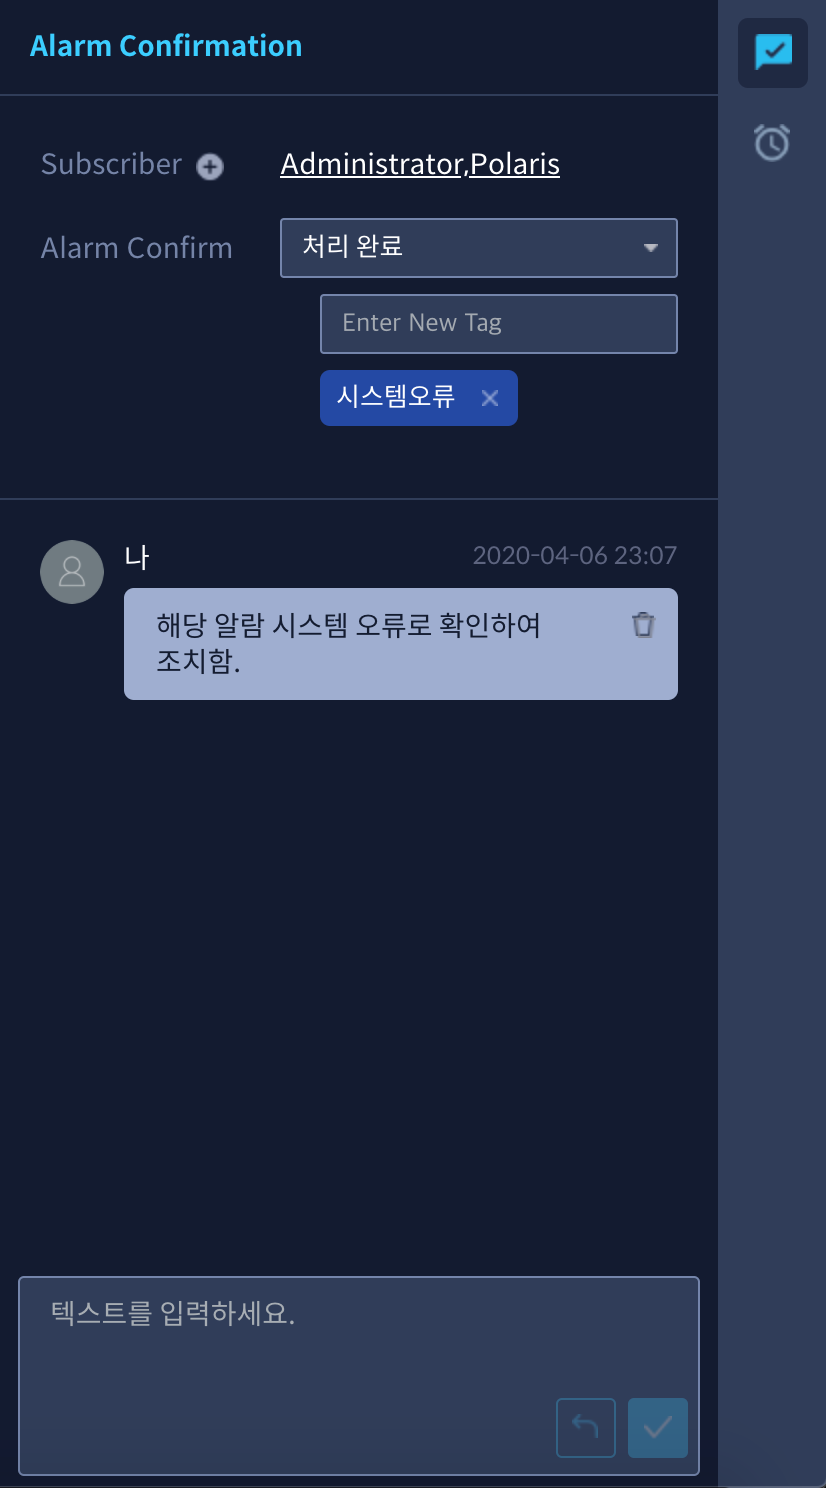
우측 탭 첫번째 메뉴에서는 알람 확인 후 해당 알람 구독자 리스트를 확인하고(Subscriber) 알람을 확인하여 상태를 기록하고(Alarm Confirm) 작업자가 기록을 남길 수 있는 커뮤니케이션 기능을 제공합니다.
There are four types of alarm confirmation items.
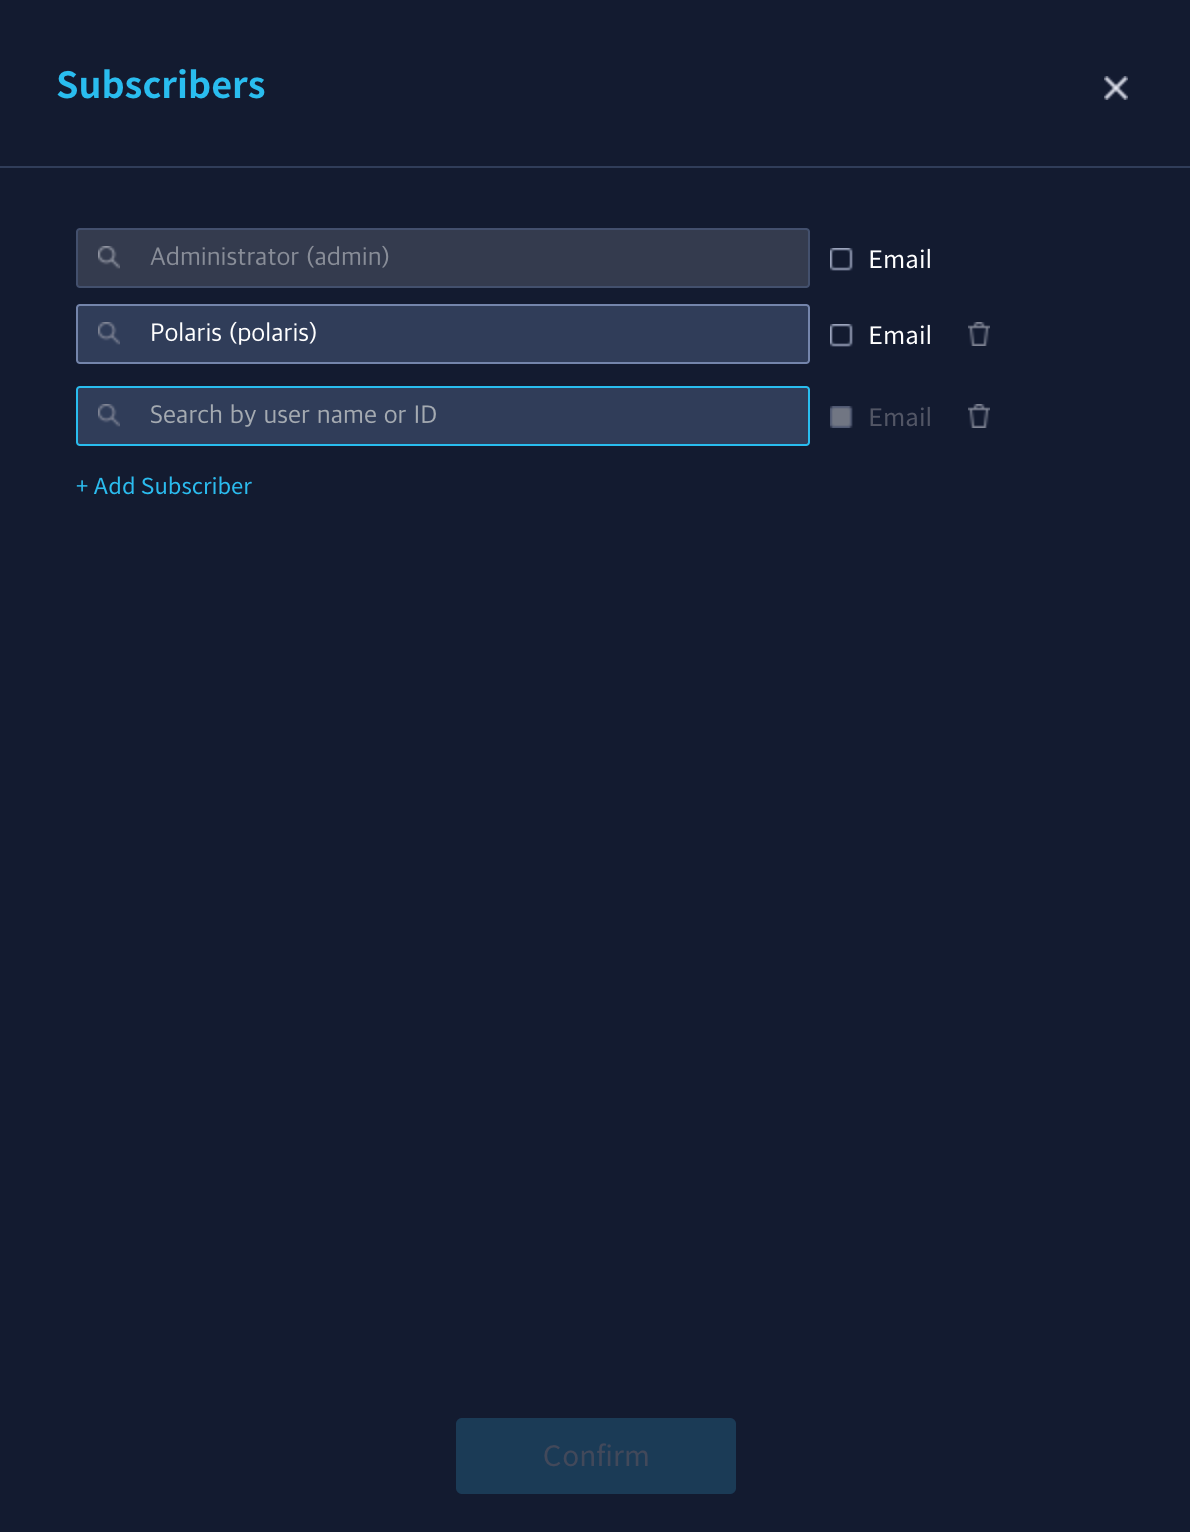
구독자(Subscriber)는 해당 알람에 관계된 유저를 아이디로 검색하여 추가할 수 있으며, E-mail에 체크하면 해당 유저 정보에 기록된 이메일로 알람을 발송합니다.
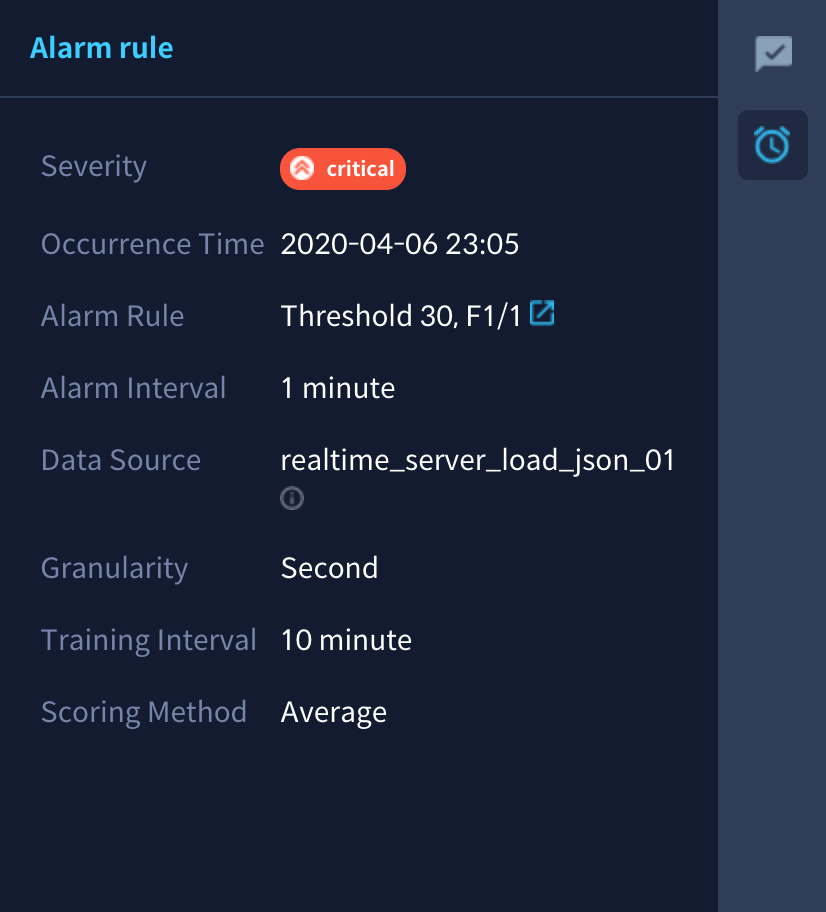
Alarm Rule
이 영역에서는 해당 알람의 심각도와 알람 발생 시각, 그리고 이 알람을 발생시킨 룰과 데이터 소스에 관련된 정보를 보여줍니다.
Severity: 현재 발생한 알람의 심각도
Occurrence Time: 알람 발생 시각
Alarm Rule: 알람을 발생시킨 임계치와 임계치 초과 건수/알람 발생 검사 주기. 우측 링크 버튼 클릭 시 해당 알람 룰로 이동
Alarm Interval: 알람 발생 검사 주기. 1분일 경우 1분마다 Abnormal score가 임계치를 넘었는지 검사
Data Source: 데이터 소스 정보
Granularity: 데이터 소스가 적재되는 시간 단위
Training Interval: 모델 학습을 위해 사용한 데이터 기간
Scoring Method: 여러 개의 측정값(Measure)을 사용할 경우 Abnormal Score를 계산하는 방식
View by Chart 탭
이 탭 영역에서는 해당 알람 구간에서 모니터링한 데이터의 Abnormal Score 를 그래프로 보여줍니다. 각 조건별 점수 임계치(Threshold)에 상응하는 알람(Critical, Major, Moderate, Low) 별로 발생된 알람의 건수를 확인할 수 있습니다. 차트 산출 방식에 관해서는 Basic principles 항목을 참조하십시오.
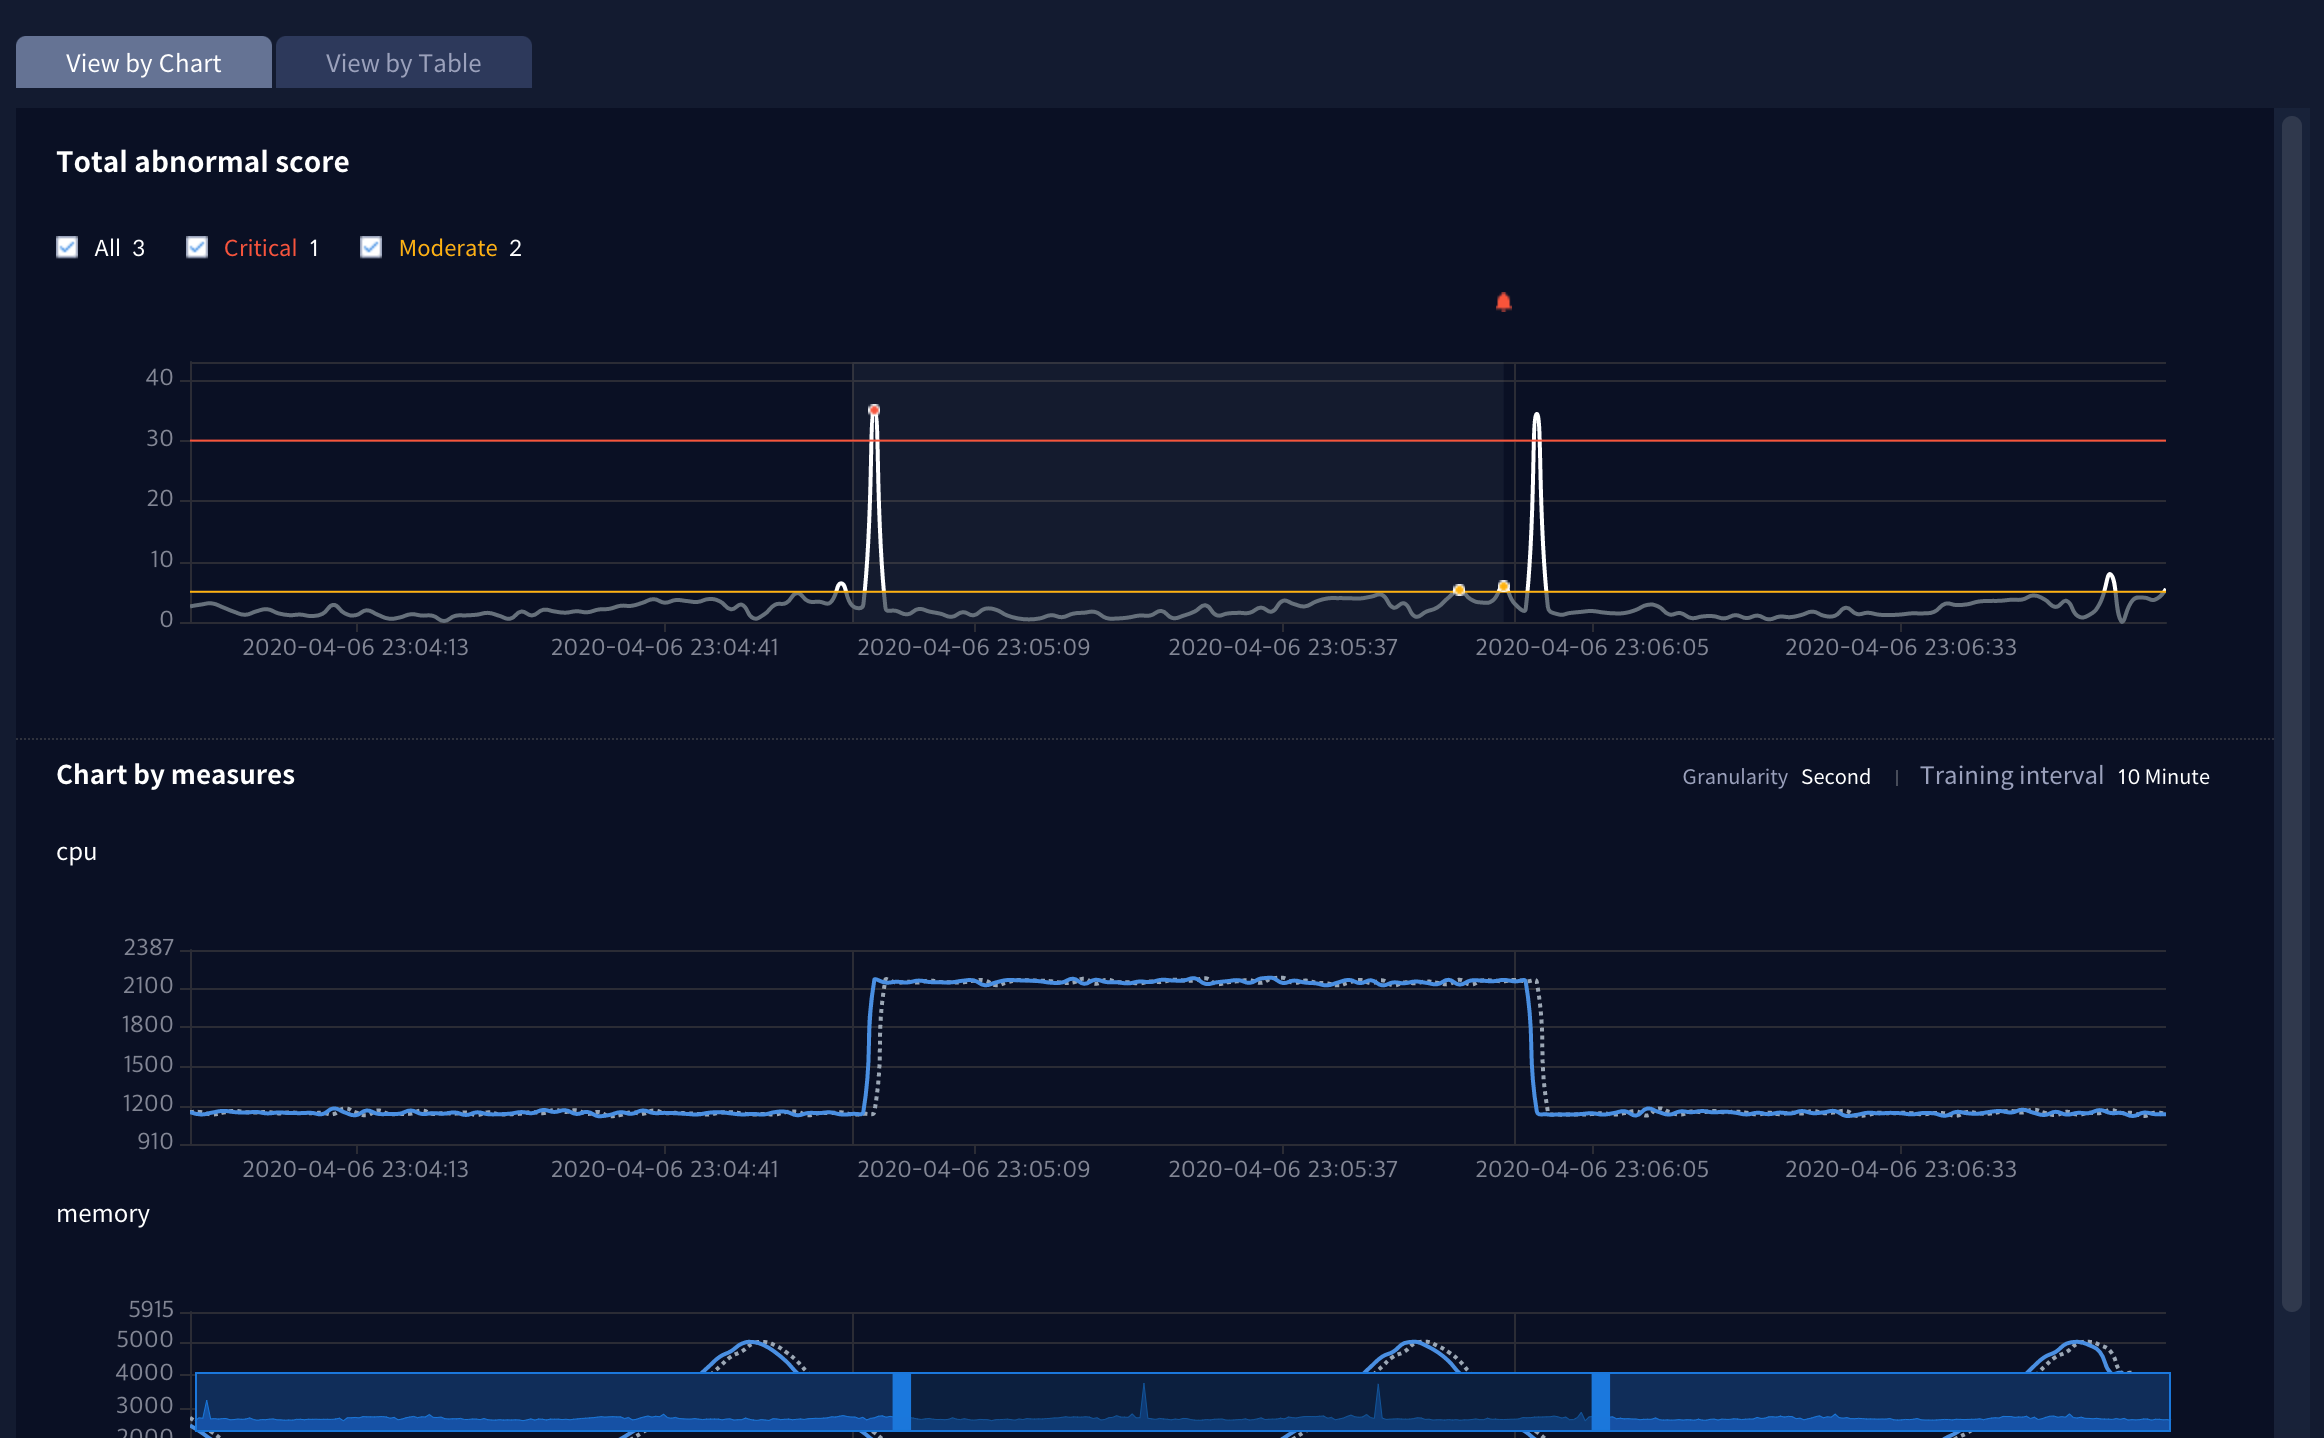
Total abnormal score: 알람 룰에 포함된 모든 측정값 컬럼에 대한 Abnormal Score를 보여줍니다.
Chart by measures: Shows the trend between the predicted value and the actual value of each individual measure column data included in the alarm rule.
