Data column list
The columns listed in the data column list are categorized into “dimensions” and “measures.” For the concept of dimensions and measures, refer to “Dimensions” and “Measures”.
Structure of the data column list
In the data column list, you can view and edit information on connected data sources, as well as add or remove column filters easily.
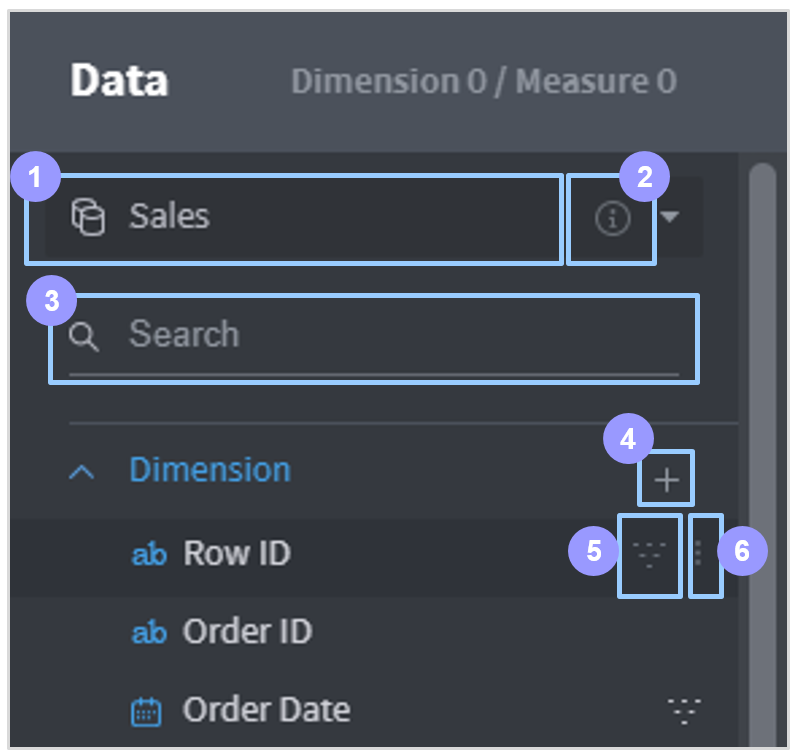
Select/set data source: Allows you to select a data source or configure its associations and joins.
Data details: Click on it to pop up a dialog box displaying information about the selected data source.
Search by column name: Searches the column list by name.
Add custom column: Click on it to open the dialog box to create a new column by combining/processing data source columns. Custom columns are commonly used throughout the dashboard.
Apply/clear filter: Hover the mouse over a column to display this button. Click on it to apply a chart filter to the column, and click again to clear the chart filter. For columns to which a filter is applied, the
icon is displayed regardless of the mouse position.
More: Hover the mouse over a column to display this button. It is used to check additional information on the column and set an alias.
: Click on it to pop up a dialog box displaying a summary of the column and its data values.
Logic column name: Shows the logical name of the column.
Type: Shows the logical type of the column.
Alias: Sets a column alias. A regular column name can contain only alphanumeric characters and a limited number of special characters with no spaces allowed. Therefore, setting an alias may help to identify the column for convenient analytics work. Aliases are commonly used throughout the dashboard.
Value alias: You can also set an alias for each data value in the column. Aliases are commonly used throughout the dashboard.
Add a custom column
Click the + button on the data source column list to open a dialog box for adding a custom column. By applying various formulas to existing columns of the data source, you can create a new column that helps create your desired chart.
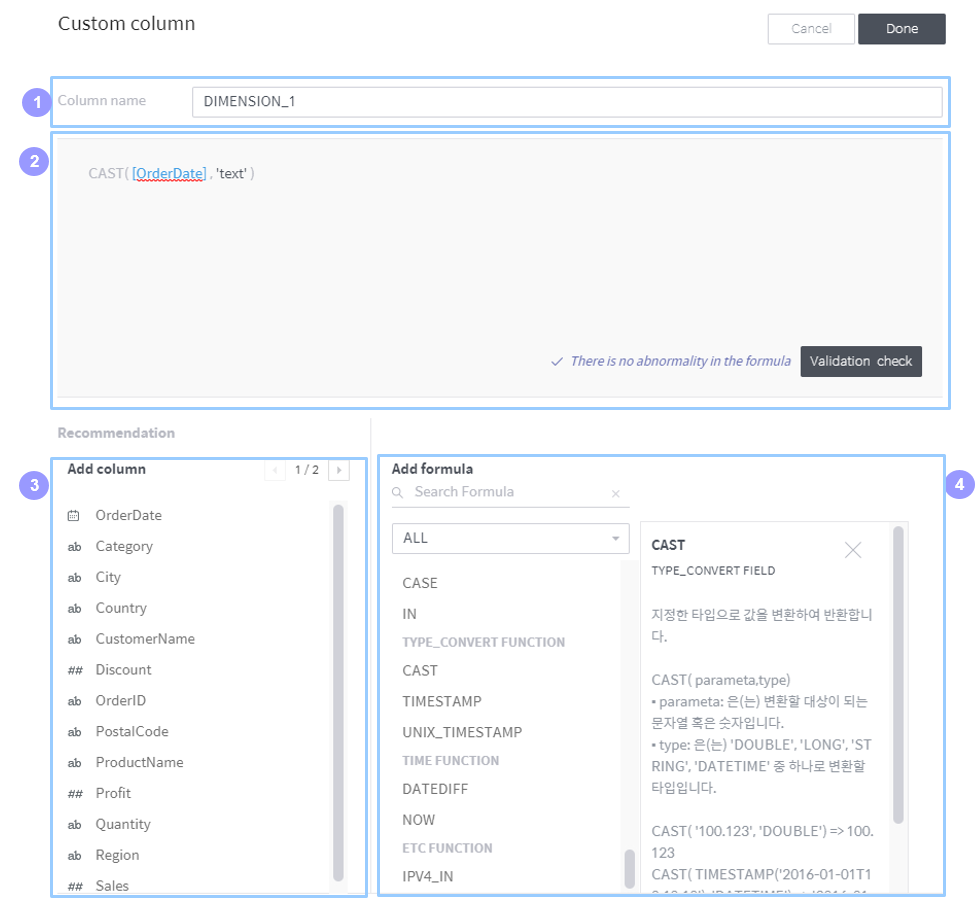
Column name: Fill in a name for the custom column.
Coding box: Write a code for the custom column. Click a list from the column or formula list below to type your selection in this box automatically.
Add column: Lists the columns of the data source. Click a column in the list to automatically type your selection in the coding box.
Add formula: Lists the formulas supported by Metatron. Click a formula in the list to type your selection in the coding box automatically, with the text cursor relocated to where a parameter needs to be inserted. For details on each formula’s purpose, use, and examples, see the help box on the right.